Tag: TWC

  • Indian subsidiary of Broadsoft blamed in Time Warner Cable data breach (updated)

    Indian subsidiary of Broadsoft blamed in Time Warner Cable data breach (updated)

    MUMBAI: Weeks after the ‘Game of Thrones’ episode leaks admitted by an Indian technology company — a Star India partner, another data leak is being blamed on the India subsidiary of Broadsoft.

    Broadsoft India’s Bengaluru-based head of support Jatin Shivalaya chose not to comment when Indiantelevision.com sought their version of the story. However, BroadSoft later wrote to Indiantelevision.com from Melbourne (Australia) stating: “BroadSoft was notified that a third-party cloud storage site containing internal BroadSoft documentation and end-user customer data was exposed to public internet. The end-user customer data exposed did not include bank or credit card information or social security numbers. We immediately re-secure d the information. BroadSoft core IT and cloud unified communication infrastructures were not exposed or compromised in this incident.”

    Charter Communications, which purchased Time Warner Cable renaming it Spectrum, acknowledged last Friday that it discovered a data breach that made the private information of some of its customers available to outsiders. Those affected were Time Warner Cable customers who mainly used the My TWC app, and the company is advising the app users to change passwords, the Hollywood Reporter said.

    A Charter representative refused to elaborate, but Gizmodo, a part of Gawker Media having brands such as Deadspin and Lifehacker, which is run in India by Times Internet, says the breach originated in India at BroadSoft, a communications company whose partners included Time Warner Cable.

    Gizmodo reported that around four million records from 2010 to 2017 were exposed, though that does not mean that it involved four million individual customers. The breached files, it said, were discovered last week by Kromtech Security while its researchers were investigating an unrelated breach at World Wrestling Entertainment. Kromtech said it downloaded the contents of the publicly accessible BroadSoft data “for verification purposes”.

    CCTV footage, which was presumably of BroadSoft’s workers in Bengaluru, (India), where the breach is believed to have originated, was also discovered on the Amazon bucket. The BroadSoft data, Kromtech said, as improperly configured to allow public access in AWS,

    The S3 buckets were accidentally configured to allow public access, potentially allowing anyone with the URL to access and download the sensitive data. It shows that companies are still making rookie mistakes when handling data.

    Not all TWC records had data on a unique customer. However, the cache size made it difficult for the researchers to pinpoint the exact number of affected persons. There were also some internal company records like credentials for external systems, internal emails, and SQL database dumps.

    BroadSoft later told Gizmodo that it locked down its Amazon data (Charter says it was taken down) and has not seen evidence that intruders accessed the information.

  • US Cable TV Industry Report: Video Subscribers again up, Business Services revenue continues to climb

    US Cable TV Industry Report: Video Subscribers again up, Business Services revenue continues to climb

    BENGALURU: For the second consecutive quarter, three of the biggest cable TV entities in the US have reported quarter-over-quarter (q-o-q) growth in video subscribers, along with the regular increase in overall video revenue for the quarter ended 31 March 2016 (Q-16, current quarter). Q1-16 also saw year-over-year (y-o-y) growth in video revenue and subscribers. Despite the increase in video subscribers, the percentage of subscribers opting for video services vis-à-vis customer relationships has declined both y-o-y and q-o-q. Another player – Verizon reported adding 36,000 net video subscribers to its wireline Fios video services in the current quarter. Overall revenue numbers were up, with video revenue increasing along with revenues from other services and streams.

    Comcast Cable Communications segment, Time Warner Cable (TWC) and Charter Communications (Charter) are the three sample players whose numbers have been used in this paper to arrive at generalisations for the US Cable TV industry. All have three major revenue streams – Video, Internet and Voice (VIVE). Besides VIVE, other revenue streams include advertisement and ‘others’. It may be noted that Charter Communications has completed the transactions with Time Warner Cable and Bright House Networks, and soon the name of the products offered by the joined entity will be under the brand Spectrum.

    Business Services Revenue continued to grow in Q1-16. Contribution by Business Services to overall revenue also continued to grow in the current quarter while contributing to the growth of overall Average Revenue Per User (ARPU) for the players as well. Another factor that contributed to overall ARPU increase was the growth in percentage of Triple Play consumers in overall customer relationships. Broadband or High Speed internet segments of the three players reported the highest growth among the three major service streams, with Voice showing the next highest growth. Video grew the least among the three services.

    According to a US Federal Communications Commission (FCC) report, the total number of Cable TV Subscribers in the US in 2012 and 2013 were 56.4 million and 54.4 million respectively. Considering the higher value of 56.4 million, the 3 players in this paper have about two thirds of the cable TV subscribers in the US. According to industry reports, the cable providers industry in the US is highly concentrated, with the top five players generating over 96 percent of revenue.

    Comcast Inc., Cable Communications (Comcast CCS) segment is the largest player by far in the US and among the sample players; Time Warner Cable, Inc., (TWC), about half the size of Comcast’s Cable communications segment in terms of revenue and Charter Communications (Charter) with revenues that are less than half again as much as TWC’s.

    Subscription numbers, revenues

    Please refer to Figures A1 and A2 below.

    In Q1-16, the combined video subscription numbers of the three players increased 0.6 percent y-o-y to 37.574 million (74.4 percent of combined customer relationships) as compared to 37.473 million (77.8 percent of combined customer relationships) and increased 0.2 percent q-o-q from 37.490 million (76.3 percent of combined customer relationships).

    Combined customer relationships in the current quarter increased 5.1 percent y-o-y to 50.488 million as compared to 48.020 million and increased 2.8 percent q-o-q from 49.114 million.

    Combined video revenues in Q1-16 increased 3.2 percent y-o-y to $9,216 million (44 percent of combined total revenue) from $8,929 million (45.6 percent of combined total revenue) and increased 1.8 percent q-o-q from $9,058 million (44 percent of combined total revenue.

    Combined total revenue in Q1-16 increased 6.9 percent y-o-y to $20,925 million from $19.569 million and increased 1.8 percent q-o-q from $20,564 million.

    Note 1:
    (a)Residential customer relationship numbers have been used in this report wherever the breakup has been mentioned in SEC filings by the concerned entity. In the case Comcast Cable Communications segment, the breakup of subscription numbers in terms of Residential and Business Services has not been indicated.
    (b) The results and the conclusions in this report may not necessarily reflect the true trends and nature of the cable communications industry in US.

    Comcast Cable Communications (Comcast CCS)

    Comcast’s CCS segment reported 0.2 percent y-o-y growth in video subscribers at 22.4 million (80.1 percent of customer relationships) in the current as compared to 22.375 million (82.2 percent of customer relationships) in Q1-15 and a 0.1 percent q-o-q growth as compared to 22.347 million (80.7 percent of customer relationships) in Q4-15.

    Customer relationships in the current quarter increased 2.7 percent y-o-y to 27.970 million from27.234 million and increased 1 percent q-o-q from 27.701 million.

    Video revenue increased 3.9 percent y-o-y in the current quarter to $5,538 million (45.4 percent of total or consolidated revenue) from $5,331 million (46.6 percent of total revenue) and increased 2.3 percent q-o-q from $5,416 million (45.2 percent of total revenue).

    Comcast CCS reported consolidated or total revenue of $12,204 million for Q1-16, up 6.8 percent y-o-y as compared to $11,430 million and up 1.9 percent q-o-q as compared to $11,980 million.

    Time Warner Cable (TWC)

    TWC reported 0.2 percent y-o-y growth in video subscribers to 10.842 million (67.2 percent of customer relationships) in Q1-16 as compared to 10.819 million (73.5 percent of total customer relationships) and also 0.2 percent q-o-q growth as compared to 10.821 million (71.5 percent of customer relationships) in the immediate trailing quarter.

    Customer relationships in the current quarter increased 9.6 percent y-o-y to 16.130 million from 14.716 million and increased 6.6 percent q-o-q from 15.129 million.

    Video revenue increased 1.6 percent y-o-y in Q1-16 to $2,508 million (40.5 percent of total or consolidated revenue) from $2,469 million (42.7 percent of total revenue) and increased 1.6 percent q-o-q from $2,471 million (40.7 percent of total revenue).

    TWC reported consolidated revenue or total revenue of $6,191 million, up 7.2 percent y-o-y from $5,777 million and up 2 percent q-o-q from $6,072 million.

    Charter Communications (Charter)

    Charter’s video subscribers increased 4.3 percent y-o-y in Q1-16 to 4.332 million (67.8 percent of customer relationships) from 4.153 million (68.4 percent of customer relationships) and increased 0.2 percent q-o-q from 4.322 million (68.8 percent of customer relationships).

    Customer relationships in the current quarter increased 5.2 percent y-o-y to 6.388 million from 6.070 million and increased 1.7 percent q-o-q from 6.284 million.

    Video revenue increased 3.6 percent y-o-y to $1,170 million (46.2 percent of total or consolidated revenue) from $1,129 million (47.8 percent of total revenue) and increased 0.3 percent from $1,167 million (46.5 percent of total revenue) in Q4-15.

    Consolidated or total revenue in Q1-16 increased 7.1 percent y-o-y to $2,530 million from $2,352 million and increased 0.7 percent q-o-q from $2,512 million.

    Average Revenue per User (ARPU) and multi-play numbers

    ARPU has been increasing as more and more customers move from single to double play and triple play and from double play to triple play. Please refer to Figures B1 and B2 below.

    Note 2:
    ARPU in the case of Charter has been estimated based on the numbers submitted by it for its residential and business services ARPU. Charter’s ARPU numbers in the above chart are likely an approximation.

    Business Services Revenue (BSR)

    All the three players offer video, data (internet) and voice services to businesses. Unlike retail customers, the proportion of data and voice services are higher than video services. Business services revenue has been growing, as has its contribution to overall revenue. BSR’s contribution to total revenue is in double digits, in the case of TWC it was 14.3 percent in Q1-16. In the case of Comcast CCS, BSR contributed $1.3 billion to overall revenue in Q1-16. Please refer to Figures C1 and C2 below.

    Note 3:
    Business services revenue numbers may have many components including revenue from the three main service streams – video, data (high speed internet) and voice as well as revenue from advertising, wholesale transport, others, etc., depending upon the entity.

    Note:
    (a)Residential customer relationship numbers have been used in this report wherever the breakup has been mentioned in SEC filings by the concerned entity. In the case Comcast Cable Communications segment, the breakup of subscription numbers in terms of Residential and Business Services has not been indicated.
    (b) The results and the conclusions in this report may not necessarily reflect the true trends and nature of the cable communications industry in US.

  • Q1-16: Time Warner Cable adds 21K video subscribers; revenue & income up

    Q1-16: Time Warner Cable adds 21K video subscribers; revenue & income up

    BENGALURU:  Following on from the previous quarter’s reversal in subscriber acquisitions, US triple play services player Time Warner Cable Inc., (TWC) reported net addition of 21,000 Video subscribers in the quarter ended 31 March 2016 (Q1-16, current quarter). Last quarter (Q4-15), for the first time since 2006, TWC had reported net video subscriber additions.

    The company reported best ever customer relationship net additionsfor Q1-16across the three services that it provides.Customer relationship net additions for Q1-2016 were 236,000 with Video net additions of 21,000, High-speed data net additions of 314,000 and Voice net additions of 178,000.

    Revenue grew 7.2 percent for Q1-16 to $6,191 million from $5,777 million, the highest first-quarter organic revenue growth in the last 8 years, which TWC says was driven by accelerated growth in Residential Services and strong growth in Business Services.

    Adjusted OIBDA was up 8.2 percent to $2,199 million for Q1-16 from $1,996 million in Q1-15. This again was the highest first-quarter organic Adjusted OIBDA growth in the last 6 years.Operating Income increased 5.6 percent to $1,145 million from $1,094 millionwhich TWC says reflects higher depreciation expense from TWC Maxx and other capital investments.

    Company speak

    TWC chairman and CEO Rob Marcus said: “Our first-quarter results are the clearest indication yet that our efforts over the last 27 months are paying off. We have made our network more reliable, our products more compelling and our customer service far better. We’ve refined our marketing, enhanced our sales channels and strengthened our retention capability. All of that has driven robust customer growth, which in Q1 translated into very strong revenue and OIBDA growth. I couldn’t be prouder of what our talented, committed, passionate team has accomplished.”

    Segment numbers

    Residential Services

    Residential Services revenue in Q1-16 increased as a result of increases in High-speed data, Video and Voice revenue which were driven by growth in subscribers across all the three services. Residential Video and High-speed data were also boosted by higher average revenue per user (ARPU), while Voice revenue growth was offset by lower ARPU.

    Residential Video services revenue increased 1.6 percent year-on-year (YoY) to $2,508 million in Q1-16 as compared to $2,468 million in Q1-15. Residential High speed data revenue increased 11.9 percent YoY in the current quarter to $1,897 million from $1,696 million. Residential Voice revenue increased 6.6 percent YoY to $504 million in Q1-2016 from $473 million. ‘Other’ revenue increased by $one million (4.2 percent) in Q1-16 to $25 million as compared to $25 million in Q1-15.

    Residential Services Adjusted OIBDA increased 5.4 percent YoY in Q1-16 to $2,193 million from $2,087 million driven by the increase in revenue, partially offset by a 6.2 percent increase in operating costs. The increase in operating costs resulted from higher programming, sales and marketing and technical operations costs, partially offset by a decrease in other operating costs. Programming costs per video subscriber increased 8.8 percent in Q1-16 to $46 from $42.28 in Q1-15. Voice costs per voice subscriber declined to $3.30 in the current quarter from $3.68 in the corresponding year ago quarter.

    ARPU

    Total Residential Customer Relationship consolidated ARPU increased 2.5 percent to $129.06 in Q1-16 as compared to $125.94 in Q1-15. NetResidential Customer Relationship ARPU in the current quarter increased 1.4 percent to $107.96 as compared to $106.46 in Q1-15.

    Residential Customer Relationship Video ARPU increased 1.3 percent to $77.25 in Q1-16 from $77.26 in Q1-15. Residential Customer Relationship speed data ARPU increased 3.1 percent in the current quarter to $49.32 from $47.82 in Q1-15. Residential Customer Relationship Voice ARPU in Q1-16 declined 9.6 percent to $26.23 from $29 in Q1-15.

    Business Services

    Business Services revenue (BS) growth was primarily due to increases in high-speed data and voice subscribers and growth in wholesale transport revenue. BS revenue increased 13.4 percent YoY in Q1-16 to $886 million from $781 million in the corresponding quarter of last year.

    The segment’s Adjusted OIBDA grew 11.9 percent YoY to $536 million in the current quarter from $479 million in Q1-15. Adjusted OIBDA increasewas driven by growth in revenue, partially offset by a 15.9% increase in operating costs and expenses, primarily due to increased headcount and higher compensation costs per employee, as well as growth in programming, voice and marketing costs.

    BS Video revenue grew 6.4 percent YoY in Q1-16 $100 million form $94 million. BS High speed data revenue grew 18.9 percent to $447 million in Q1-16 as compared to $376 million in the corresponding quarter of the previous year. BS Voice revenue in Q1-16 increased 13.4 percent YoY in the current quarter to $161 million from $142 million in the corresponding year ago quarter. BS Wholesale transport revenue increased 7.4 percent YoY in Q1-16 to $130 million from $121 million. ‘Other’ revenue remained flat at $48 million for Q1-16 and Q1-15.

    Other Operations

    Other operations include Advertising. Total revenue from other operations increased 10.6 percent to $244 million in Q1-16 from $230 million in Q1-2015. Adjusted EBIDTA increased 18.4 percent YoY in the current quarter to $193 million from $163 million.

    Advertising revenue in Q1-16 increased 6.1 percent to $244 million from $230 million in Q1-15.  Advertising revenue increased primarily due to growth in political advertising revenue.‘Other’ revenue increased 16.7 percent YoY in the current quarter to $196 million from $198 million.Other revenue increased primarily due to the recognition of approximately $20 million of revenue associated with the settlement of a contractual dispute, as well as an increase in affiliate fees from the Residential Services segment and other distributors of the Los Angeles Lakers’ regional sports networks and SportsNet LA.


  • Q3-2015: Time Warner Cable – residential Internet data ascend, video slide; Business Services numbers up

    Q3-2015: Time Warner Cable – residential Internet data ascend, video slide; Business Services numbers up

    BENGALURU: The slide in retail or residential video numbers continues for the US television cable industry, if one were to go by the numbers reported by Comcast Cable Communications division and now by Time Warner Cable Inc., (TWC) for the quarter ended 30 September, 2015 (Q3-2015). Data, or more specifically high speed data continues its juggernaut, climbing YoY and QoQ.  The company’s Business Services segment reported increase in numbers across all parameters.

    TWC’s consolidated revenue in the current quarter increased 3.6 per cent (increased by $208 million) to $5922 million from $5714 million in Q3-2014, but declined marginally (declined by 0.1 per cent or $4 million) from $5926 million in the immediate trailing quarter.

    Note: 100,00,000 = 100 lakh = 10 million = 1 crore

    Subscription numbers have been mentioned in lakhs and revenue and other financial numbers in millions of US dollars.

    Time Warner Cable chairman and CEO Rob Marcus said, “I’m very excited about the operating momentum reflected in our third-quarter results. Subscriber growth was the strongest in years; revenue growth accelerated; and we continued to make significant investments in our network, equipment, products and customer service. Our ongoing transformation is a testament to the strength of our operating plan and the commitment of our entire team – all 55,000 employees – who work tirelessly every day to make Time Warner Cable an even better company.”

    Residential numbers

    Customer relationships

    For Q3-2015, TWC has reported amongst the best subscriber numbers over a long time, and this improvement is reflected by the low drop in video numbers of only 7000 that the company has reported. Residential High Speed Internet Data (Data) and Voice customers have both increased YoY and QoQ basis. Voice has shown the largest YoY and QoQ growth in terms of number of subscribers as well as in percentage terms.  

    Overall, TWC’s total customer relationships (including business services) increased 3.3 per cent (increased by 472,000) in Q3-2015 to 156.63 lakh from 151.31 lakh in Q3-2015 and by 1.1 per cent (increased by 163,000) from 155 lakh in the previous quarter. Please refer to Fig A below.

    Residential or retail customer relationships improved to an all-time high of 149.29 lakh in the current quarter as compared to the 144.57 lakh in Q3-2014 or the 147.82 lakh in the previous quarter.  

    Business Services saw increase across all three plays, both YoY and QoQ. Business Services customer relationships increased 8.9 per cent (increased by 60,000) YoY to 734,000 in Q3-2015 from 674,000 in Q3-2014 and increased by 2.2 per cent (increased by 16,000) from 718,000 in Q2-2015.

    Video Numbers

    Please refer to Fig B below.

    Video revenue declined 1.8 per cent (declined $44 million) YoY in Q3-2015 to $ 2453 million from $2497 million and declined 2.4 per cent from $2514 million in the immediate trailing quarter. Video customer relationships declined 0.6 YoY to 107.67 lakh from 108.27 lakh and declined QoQ from 107.74 lakh.

    Within TWC’s Video segment, six products or sub-segments contribute to revenue. The major segment is Programming tiers, which contributed $1566 million or about 64 per cent to Video revenue and more than 26 per cent to TWC’s consolidated revenue in the current quarter. The other sub-segments are Premium networks ($216 million, about nine per cent of video revenue in Q3-2015); Transactional Video-on-demand ($45 million, about two per cent of video revenue in Q3-2015); Video equipment rental and installation charges ($362 million, about 15 per cent of Video revenue in Q3-2015); Digital video recorder service ($150 million, about six per cent of Video revenue for Q3-2015) and Franchisee and other fees ($114 million, about five per cent of Video revenue for Q3-2015).

    Except for Premium tiers and Video equipment rental and installation charges, revenue from all the other sub-segments declined both YoY and QoQ. 

    High Speed Internet (Data) numbers

    Data revenue increased 9.4 per cent (increased $152 million) in the current quarter to $1772 million from $1620 million in Q3-2014 and increased 1.7 per cent (increased $30 million) from $1742 million in the immediate trailing quarter.

    TWC’s Data customer relationships in the current quarter increased 7.7 per cent YoY to 123.94 lakh from 119.90 lakh and 1.9 per cent QoQ from 121.62 lakh, while voice customers increased 22.1 per cent YoY to 60.93 lakh in the current quarter from 49.89 lakh in Q3-2014 and by four per cent from 58.56 lakh in the previous quarter. Please refer to C below.

    Voice Numbers

    TWC’s Voice revenue increased 1.5 per cent (increased $7 million) to $483 million in the current quarter from $476 million in Q3-2014 and increased one per cent (increased by $5 million) in the immediate trailing quarter.

    Voice subscribers increased 22.1 per cent (increased by 1,104,000) to 60.93 lakh in Q3-2015 from 49.89 lakh in Q3-2014 and increased four per cent (increased 237,000) from 58.56 lakh in Q2-2015.

    Single Play, double play and triple play

    The company’s residential single play customer relationships have been slowly increasing over time. Single play relationships in the current quarter increased by 0.6 per cent (35,000) to 57.09 lakh YoY from 56.74 lakh and by 0.9 per cent (50,000) from 56.59 lakh. Please refer to Fig D below.

    Double play customers have been declining over time, with the decline steepening even further since Q3-2014. In the current quarter, double play customer declined YoY by double digits – 12.4 per cent (declined 585,000) to 41.14 lakh from 47 lakh and declined 2.9 per cent (declined 121,000) QoQ from 42.36 lakh.

    Triple play customers have been increasing, the increase becoming more rapid since Q3-2014, indicating to an extent that double play customers were adding one more play, rather than the company losing double play customers, besides adding more new customers for residential triple play. Triple play customers in Q3-2015 increased 25 per cent (increased 1,022,000) to 51.05 lakh from 40.83 lakh in the corresponding year ago quarter and increased 4.5 per cent (increased 218,000) from 48.87 lakh in Q2-2015.

    Business Services

    While TWC’s Business services segment had only 4.7 per cent of TWC’s overall customer relationships, it contributed 14.1 per cent to TWC’s consolidated revenue. As a matter of fact, its contribution to TWC’s revenue has been increasing much faster than the increase in its customer relationship share in the overall pie. BS revenue in the current quarter increased 15.5 per cent (increased by $112 million) in Q3-2015 to $836 million (14.1 per cent of consolidated revenue from 4.7 per cent of overall customer relationships) from $724 million (12.7 per cent of consolidated revenue from 4.5 per cent of overall customer relationships) in the corresponding year ago quarter and increased 4.1 per cent (increased by $33 million) from $803 million (13.6 per cent of consolidated revenue from 4.6 per cent of overall customer relationships) in the immediate trailing quarter. Please refer to Fig E below.

    Revenue from Business Services High Speed data was more than 4 times the revenue from Business services video sub-segment or product in Q3-2015.

  • Dish, NAB & others urge FCC to deny Charter-Time Warner Cable merger

    Dish, NAB & others urge FCC to deny Charter-Time Warner Cable merger

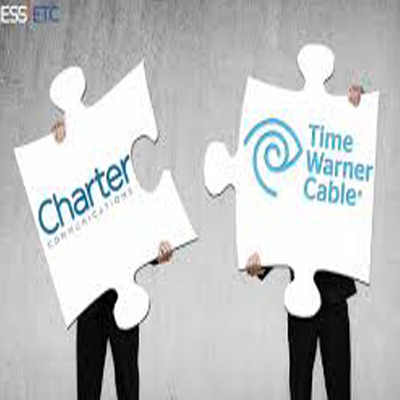
    MUMBAI: The Charter Communications, Inc – Time Warner Cable, Inc merger is facing a lot of opposition from broadcasters. 


    The National Association of Broadcasters (NAB) has filed a petition with the Federal Communications Commission (FCC) that it should not approve the merger unless it is also willing to change broadcast ownership rules, which limits the number of radio and TV stations that a single entity can own.


    Joining the NAB is Dish Network Corp, which has filed a petition with the FCC to deny the proposed merger citing substantial harm to competition and consumers. Additionally, set top box maker Zoom Telephonics also asked the FCC to deny the said merger between the two over the issue of access to third-party modems.


    As broadcast ownership rules limit mergers, NAB said that broadcasters have far less negotiating power than big cable companies, which will only get bigger if the FCC allows the latest cable merger to proceed.


    According to the NAB, the greater imbalance will harm broadcasters in retransmission consent negotiations, in which cable operators pay broadcast stations for the right to air their channels.


    NAB said that if the pending merger was approved, then the top four multichannel video programming distributors (MVPDs) will control 79 per cent of the nationwide MVPD market, measured in terms of subscribers, and the top three alone, according to SNL Kagan, “will control two-thirds of the video delivery universe.” If consummated, the merger also would exacerbate concentration levels at the local and regional levels, with clear implications for consumers, as empirical research has shown that large, clustered cable companies charge higher prices than smaller, unclustered ones.


    The creation of yet another pay-TV behemoth would further competitively disadvantage local broadcast stations kept by outdated ownership rules from achieving a fraction of the vital economies of scale and scope that MVPDs enjoy and, as the FCC has recognized, can advance the public interest. The gross regulatory disparities between the pay-TV and the free-TV industries are illustrated in any number of ways, including the sheer size of MVPDs compared to TV broadcasters. The market capitalization of the combined AT&T/DIRECTV, for example, is more than 200 times larger than the market cap of several of the most sizable broadcast TV companies. New Charter – which the merging parties describe as “modest” in size – will have a market capitalization 72 times larger than some of the biggest broadcast TV station groups. Beyond this national scale, single pay-TV providers control access to significant percentages of viewers in many local markets. Even standing alone, Time Warner Cable (TWC), for instance, controls over 40 percent of the total MVPD market in 30 different Designated Market Areas (DMAs), and in eight DMAs, TWC’s share of the entire MVPD market exceeds 60 percent. Broadcast TV stations unable to combine under the FCC’s local TV ownership rule are at a notable disadvantage in negotiating retransmission consent agreements with such locally and nationally consolidated MVPDs.


    On the other hand, Dish Network Corp’s petition to deny the merger, outlines, among other things, the critical role that high-speed broadband plays in the video industry and the potential for the merger to significantly damage competitive development of over-the-top (OTT) video and limit consumer access to online video programming.


    Dish Network said that the merger presents risk of significant harms:


    New Parties, Same Harms: The proposed transaction would be no better for the public interest than the one proposed between Comcast and Time Warner Cable.


    A Suffocating Duopoly: The transaction will create a suffocating duopoly. Where a Comcast/Time Warner Cable merger would have created one behemoth, this transaction will result in two broadband providers (Comcast and New Charter) controlling about 90 per cent of the nation’s high-speed broadband homes between them.


    Threats to Online Video: The top two cable providers post-merger will not need to collude in order to bring their collective weight to bear on an online video distributor (OVD). Parallel foreclosures, with one of the two following the other, would be enough for an OVD to be shut off from most of the homes in the country.


    Concentration of Broadband Subscribers: The impact of New Charter would cause a significant proportion of the combined company’s high-speed broadband subscribers to lack access to alternative high-speed broadband options. Indeed, Charter admits that almost two-thirds of households in the New Charter footprint will not have access to at least one alternative high-speed broadband provider. For these customers, switching ISPs is not just an inconvenience, but an impossibility.


    Choke Points on the Charter/TWC Broadband Network: New Charter would have a panoply of foreclosure techniques at its disposal. It would be able to foreclose or degrade the online video offerings of competing MVPD and OTT video providers at any of three “choke points”: (1) the points of interconnection to the combined company’s broadband network, in effect the “on ramp” to the New Charter network; (2) the “public Internet” portion of the pipe to the consumer’s home; and (3) managed or specialised service channels, which can act as super HOV-lanes and squeeze the capacity of the “public Internet” portion of the New Charter broadband pipe. In addition, New Charter would have increased leverage that it could use to coerce third-party content owners and programmers to withhold online rights from online video platforms, thereby stifling a source of competition and innovation in the video industry.


    Sling TV CEO Roger Lynch states, “I believe that the proposed merger…. would cause significant and irreparable harm to emerging competitive online video products and services, as well as the performance of traditional satellite television service, ultimately reducing competition and choice for consumers. Accordingly, I believe that the merger as currently constructed is not in the public interest and should be denied.”

  • Q2-2015: US Cable industry: Internet, biz services continue as growth drivers; video continues to lose subscribers

    Q2-2015: US Cable industry: Internet, biz services continue as growth drivers; video continues to lose subscribers

    BENGALURU: The cable industry in the US continues to bleed video subscribers, albeit slower than earlier, while internet and business services continue to be growth drivers in terms of subscription numbers and revenue, if one were to go by the results reported by five major players in the US for the quarter ended 30 June, 2015 (Q2-2015). Overall, YoY and QoQ subscription numbers or customer relationships of the bigger three of the five players in this report have increased.

    The five players in this report are Comcast Inc., Cable Communications segment, the largest player by far among the sample players in this report; Time Warner Cable, Inc., (TWC), a little less than half the size of Comcast’s Cable communications segment in terms of revenue; Charter Communications with revenues that are less than half again as TWC’s. Cablevision, the fourth player in the sample had a little more than two-thirds of Charter’s revenues in Q2-2015, while the smallest, Suddenlink whose major operating areas includeArizona, Arkansas, Louisiana, North Carolina, Oklahoma, Texas, West Virginia, had revenue that was a little more than a third of Cablevision’s revenue in Q2-2015.  

    Despite the continued slide in video customer relationship, the combined sum of video subscribers in Q2-2015 of the five entities is about 4.09 crore or almost two thirds (62 per cent) of the 6.6 crore video subscribers through wire in the US as of 2013. The five players in this report are generally considered amongst the biggest players in the US cable television industry. All have three major revenue streams – Video, Internet and Voice (VIVE).

    Note: (a) 100,00,000 = 100 lakh = 10 million = 1 crore

    (b) While denominations for $have been mentioned in millions or billions where applicable, denominations for numbers have been mentioned lakhs and crores.

    (c)Residential customer relationship numbers have been used in this report wherever the breakup has been mentioned in SEC filings by the concerned entity.

    (d) The results and the conclusions in this report may not necessarily reflect the true trends and nature of the cablecommunications industry in US.

    It is noteworthy that an even smaller company, Mediacom Broadband alone, without Mediacom LLC numbers, had revenue of about $246 million (Rs 1626.53 crore, ($1 = Rs 63.5363 as on 30 June, 2015) in Q2-2015, many times more than the revenue generated by the largest cable company in India. Mediacom Broadband’s revenue was less than half $608.02 million revenue reported by Suddenlink in Q2-2015.

    Performance in Q2-2015

    In general, six streams add to most of the five entities’ revenue – three products -Video, high speed Internet, Voice; Business Services (BS); Advertising; and Other. Collectively, the first three have been given the acronym VIVE by the author. Generally VIVE numbers, be they subscription or revenue indicate residential subscribers and revenue from these subscribers in this report. Some of the companies don’t indicate the breakup of VIVE revenue from business services, and hence these figures could be included in the overall VIVE revenue .This reports examines VIVE and touches briefly upon business services of some of the players in this report later on.

    In general, Internet has been driving growth, both in terms of revenue and subscription numbers. Contribution by business services is growing and is in the sub or low double digits in terms of percentage of overall revenue.

    Subscription numbers in Q2-2015

    Figure A below displays the subscription numbers of the five players considered in this report. Individual as well as combined Video subscribers or Video customer relationships have dropped year-on-year (YoY) and quarter-on-quarter (QoQ) during Q2-2015. Internet subscription numbers of all the five players in this report have increased, while Voice subscription numbers of four of the five companies have gone up. Cablevision has reported a small dip in Voice subscription numbers in Q2-2015.

    YoY and QoQ combined Total Customer Relationships of all the five players have gone up in Q2-2015 by 2.03 per cent and 0.24 per cent respectively. In Q2-2015, the combined Total Customer Relationships of all the five companies was 525.64 lakh as compared to 515.19 lakh in Q2-2014 and 524.41 lakh in Q1-2015. Though QoQ customer relationships of all the five companies have gone up, in the case of Cablevision and Suddenlink, customer relationships were actually lower in Q2-2015. Cablevision saw a decline 1.52 per cent in Q2-2015 to 31.17 lakh as compared to the 31.65 lakh in Q2-2014, while Suddenlink saw a QoQ decline of 0.86 per cent to 14.39 lakh in Q2-2015 from 14.52 lakh.

    Video

    As mentioned above, the US Cable communications industry continues to lose video customers. YoY, the combined Total Customer Relationships declined 1.53 per cent to 409.40 lakh in Q2-2015 as compared to the 415.74 lakh. QoQ the decline was 0.47 per cent from 411.32 lakh. Suddenlink saw the highest YoY drop among the five players in this report in Video subscribers at 5.66 per cent (lost 66200 subscribers) to 11.03 lakh in the current quarter as compared to 11.69 lakh in Q2-2014. Suddenlink’s YoY decline in Video customers was also the steepest among the five companies at 2.6 per cent (lost 29400 subscribers) from 11.32 lakh in Q1-2015. 

    In absolute numbers, TWC had the highest YoY decline of video subscribers among the five players in the current quarter of 2.27 lakh to 107.74 lakh from 110.11 lakh. QoQ, Comcast’s Cable communications has seen the largest fall in absolute numbers among the 5 companies, a fall of 69,000 (0.31 per cent) Video subscribers in Q2-2015 to 223.06 lakh from 223.75 lakh in the immediate trailing quarter.

    Internet

    Overall, the five entities reported a 6.07 per cent YoY increase in Internet subscribers in Q2-2015 at a combined total of 436.33 lakh from 411.36 lakh in the corresponding year ago quarter and a one per cent increase from 432.01 lakh in the immediate trailing quarter. The five entities gained 24.965 lakh subscribers YoY and 4.322 lakh subscribers QoQ in Q2-2015. As is obvious, the number of internet subscribers exceeds the number of video subscribers.

    All the five companies in this report witnessed a YoY increase in Internet subscribers. Charter had highest growth in percentage terms at 8.6 per cent ( gained 3.93 lakh subscribers) increase in Internet subscription in Q2-2015 with the subscriber base reaching 49.61 lakh from 45.68 lakh in the corresponding year ago quarter and 1.43 per cent higher (gained 70000 subscribers) QoQ from 48.91 lakh. 

    QoQ, both TWC (gained 7.47 lakh subscribers) and Charter reported 1.43 per cent growth in Q2-2015, while Comcast and Cablevsion reported 0.80 (gained 1.79 lakh subscribers) and 0.51 growth (gained 14000 subscribers) in Internet subscribers. Suddenlink reported a slight QoQ decline of 0.24 per cent (lost 2800 subscribers) to 11.81 lakh in the current quarter as compared to the 11.84 lakh in the immediate trailing quarter.

    In absolute numbers, Comcast Cable Communications reported the highest YoY and QoQ Internet subscription growth among the five companies in Q2-2015 at 12.77 lakh (six per cent) and 1.79 lakh (0.80 per cent) respectively.

    Voice

    The five entities reported a 6.19 per cent YoY growth and a 1.48 per cent QoQ growth in combined Total Voice Subscriber base of 224.55 lakh in Q2-2015. This translates to a YoY increase of 13.092 lakh and QoQ increase of 3.275 lakh subscribers in absolute numbers.

    Except for Cablevision, the other four players reported YoY and QoQ increase in subscription numbers. Cablevison reported a YoY decline of 2.86 per cent (65000) and a QoQ decline of 0.32 per cent (7000) in Voice Subscribers in Q2-2015 to 22.08 lakh from 22.73 lakh in Q2-2014 and from 22.15 lakh in Q1-2015 respectively.

    The highest YoY growth in Voice subscribers among the five players in this report in Q2-2015 in percentage as well as absolute numbers was 17.71 per cent and 8.81 lakh by TWC, which saw its numbers grow to 58.56 lakh from 47.75 crore in Q2-2014. TWC also reported the highest QoQ growth in percentage and absolute terms in Voice subscribers among the five players by 4.5 per cent and 2.52 lakh to 58.56 lakh in Q2-2015.

    Single, double and triple play numbers

    Four of the five players have indicated the breakup of their single, double and triple play customer relationships.

    Generally, all have been losing single play and double play subscribers either because of conversion from single to double or triple play, or from double to triple play, or because of subscriber churn, while Suddnelink has also reported numbers than indicate growth in its non-video customer relationships.

    Revenue numbers in Q2-2015

    Please refer to Fig A1 below. Combined Total revenue of all the five players in this report increased YoY 2.46 per cent ($517 million) to $21566 million from $21049 million in Q2-2014, but declined 0.2 per cent ($43 million) from $21609 million in Q1-2015. Charter saw the largest YoY increase of total revenue in percentage terms among the five at 7.57 per cent ($171 million) in Q2-2014. In absolute numbers, Comcast Cable Communications segment reported the highest YoY growth of total revenue of $700 million (6.35 per cent) and QoQ growth of $399 million (2.62 per cent) in the current quarter. QoQ, Suddenlink saw the highest growth in Total revenue among the 5 players in percentage terms of 3.36 per cent ($28 million) in Q2-2015.

    Combined YoY and QoQ VIVE revenues of all the five entities increased 5.15 per cent ($890 million) and 1.43 per cent ($257 million) respectively in Q2-2015$ 18170 million. Here also, Charter reported the highest YoY growth in percentage terms of VIVE revenue of 7.07 per cent ($134 million) in Q2-2015. QoQ, Suddenlink reported the highest growth among the five players in percentage terms at 3.49 per cent ($31 million) in the current quarter.

    As far as absolute US dollars are concerned, Comcast’s Cable Communications segment reported the highest YoY and QoQ growth at $455 million (5.07 per cent) and $154 million (1.66 per cent) respectively in Q2-2015.

    Among the three products, Video was the biggest contributor to revenue of all the five companies in this report. Video’s contribution to VIVE revenue was in the range of 50 to 60 per cent. Internet contributed between 25 and 35 per cent and Voice between 6 to 17 per cent to VIVE revenue.

    YoY, combined Total Video and combined Total Internet revenue increased by 2.04 per cent and 13.22 per cent respectively, while Voice revenue declined by 1.89 per cent. QoQ, Video, Internet and Voice revenue in Q2-2015 increased by 1.08 per cent, 2.41 per cent and 0.15 per cent respectively.

    Video

    Despite a drop in Video Customer Relationships, combined Total Video revenue YoY increased by $204 million and increased QoQ by $109 million to $10198 million in Q2-2015. The highest increase in Video revenue among the five players was by Comcast at 3.66 per cent and $192 million in Q2-2015, while Suddenlink saw its Video Revenue drop by 0.68 per cent and $2 million in Q2-2015.

    Internet

    Combined Internet revenue of the five players in this report increased by 13.22 per cent and $720 million YoY and increased QoQ by 2.41 per cent and $145 million to $$6171.4 million in Q2-2015.

    The highest YoY as well as QoQ growth in percentage terms of Internet revenue among the five players was by Suddenlnk with 17.07 per cent ($31 million) and 4.40 per cent ($9 million) respectively in the current quarter. In absolute US dollar terms, Comcast Cableshowed the highest YoY and QoQ growth at $282 million (10 per cent) and $57 million (1.87 per cent) respectively.

    Voice

    Though Voice subscription numbers have been growing, the combined Voice revenue of the 5 players declined YoY by 1.89 per cent ($35 million) to $1800 million. The combined voice revenue of the players increased marginally QoQ by 0.15 per cent ($3 million) in the current quarter. 

    The big three players – Comcast Cable Communications, TWC and Charter saw their YoY Voice revenue decline by 2.06 per cent ($19 million), 2.45 per cent ($12 million) and 6.9 per cent ($10 million) respectively. Cablevision and Suddenlink saw their YoY Voice revenue increase by 2.2 per cent ($5 million) and 2.53 per cent ($1 million) respectively.

    Comcast Cable Communications and Suddenlink saw their QoQ Voice revenues drop 0.33 per cent ($3 million) and 0.48 per cent ($0.25 million) in the current quarter, while TWC and Charter saw their YoY Voice revenues increase by 1.06 per cent ($5 million) and 0.75 per cent (one million) respectively . Cablevision’s Voice revenue remained flat in Q1-2015 and Q2-2015 at $232 million.

    Comcast Cable, TWC and Charter have indicated business services revenue in their quarterly filings. Please refer to Fig B below. As is obvious, business services revenue (BSR) has been going up in value as well as in terms of percentage of Overall or Total Revenue (OR)

  • Q1-2015: Turner record results overcome Warner Bros, HBO downturn for Time Warner

    Q1-2015: Turner record results overcome Warner Bros, HBO downturn for Time Warner

    BENGALURU: Turner’s record adjusted operating income growth of 26 per cent to $1128 million for Q1-2015 as compared to the $895 million in Q1-2014 was offset in part by declines at Warner Bros. and Home Box Office (HBO) says Time Warner Inc.


    Time Warner’s adjusted operating income grew 11.6 per cent to a record $1814 million during the quarter ended 31 March, 2015 (Q1-2015, current quarter) as compared to the $1626 million in Q1-2014. Time Warner revenue was up 4.8 per cent to $7127 million in Q1-2015 as compared to the $6803 million during the corresponding quarter of last year. The revenue increase was due to growth in all divisions says the company.


    Time Warner chairman and CEO Jeff Bewkes said, “We got off to a very strong start in 2015, with revenues up five per cent, and adjusted operating income growing 12 per cent to a quarterly record of $1.8 billion. This led to a 23 per cent increase in adjusted EPS and puts us on track to achieve our goals for the year. We accomplished a lot in the quarter, led by Turner, which had its best quarter ever, with audience growth across a number of its networks. The NCAA Men’s Basketball Tournament was a huge multiplatform success, with its highest average television viewership in over two decades helping make TBS the #1 ad-supported cable network in primetime among adults 18-49 in the quarter. And March Madness Live served more than 80 million live video streams and grew its usage by almost 20 per cent over last year’s tournament. Warner Bros. led the domestic box office for the quarter on the strength of American Sniper, which brought in well over $500 million globally. Warner Bros. also continued to lead the industry in television production, including the #1 comedy and unscripted series among adults 18-49 on television this season. HBO once again grew domestic subscribers in the quarter while continuing to gain acclaim for groundbreaking programming such as the recent documentaries Going Clear: Scientology and The Prison of Belief and The Jinx: The Life and Deaths of Robert Durst. The return of Game of Thrones reached a new premiere high, while also providing the backdrop for the highly-anticipated launch of HBO Now, our standalone streaming version of HBO – which is off to a great start. Reflecting our strong commitment to provide direct returns to shareholders, we returned more than $1.4 billion in dividends and share repurchases year-to-date.”


    Segment Results


    Turner

    Turner reported 4.5 per cent growth in revenue to $2710 million in Q1-2015 from $2593 million in Q1-2014. Turner’s adjusted operating income has been mentioned above.


    The company says that Turner benefited from growth of four per cent ($42 million) in advertising revenues, three per cent ($38 million) in subscription revenues and 25 per cent ($37 million) in content and other revenues.


    Turner advertising revenues benefited from growth at Turner’s domestic businesses mainly due to the 2015 NCAA Division I Men’s Basketball Championship tournament (NCAA Tournament) and growth at Turner’s news businesses. Subscription revenues grew due to higher domestic rates partially offset by lower domestic subscribers. Both international advertising and international subscription revenue growth were more than offset by the impact of foreign exchange rates. The increase in content and other revenues was due to higher subscription video-on-demand revenues.


    Turner’s adjusted operating income increased 26 per cent primarily due to higher revenues and lower expenses, including lower marketing, programming and general and administrative costs, largely as a result of operational efficiency initiatives and timing. Programming costs declined three per cent due primarily to timing and lower syndicated programming expenses as a result of the abandonment of certain programming in 2014.


    HBO


    Home Box Office revenue in Q1-2015 was up 4.4 per cent to $1398 million as compared to the $1339 million in Q1-2014. Adjusted operating income fell 1.3 per cent to $458 million in Q1-2015 from $468 million in the corresponding year ago quarter.


    According to the company, HBO revenues grew four per cent and reflect increases of four per cent ($49 million) in subscription revenues and five per cent ($10 million) in content and other revenues. Subscription revenues increased primarily due to higher domestic rates, partially offset by the transfer to Turner of the operation of HBO’s basic cable network in India. The increase in content and other revenues reflected higher home entertainment revenues and higher international licensing revenues.


    HBO adjusted operating income declined one per cent ($6 million) to $458 million, as higher revenues were more than offset by higher programming, distribution and marketing costs. Programming costs grew nine per cent, primarily due to increased expenses for original programming. Distribution costs increased primarily due to higher participation expenses. The increase in marketing costs was primarily related to the launch of HBO Now.


    Time Warner informs that through the first two weeks, the fifth season premiere of Game of Thrones totalled 18.1 million gross viewers, over one million more viewers than the prior season’s first episode after the same period of time. In April 2015, Home Box Office launched HBO Now, its stand-alone streaming service, in the US.


    Warner Bros


    Warner Bros revenue grew 4.3 per cent to $3199 million in the current year from $3066 million in Q1-2014. Adjusted operating income declined 13.2 per cent to $330 million in Q1-2015 from $380 million reported in the corresponding year ago quarter.


    Warner Bros revenue increase, reflects higher television licensing revenues primarily due to the subscription video-on-demand sale of Friends and higher revenues from videogames. Revenues also benefited from growth in theatrical revenues led by the strong performance of American Sniper. The increase was partially offset by the effect of foreign currency exchange rates.


    Adjusted Operating Income declined 13.2 per cent, as higher revenues were more than offset by higher film and advertising costs due to the mix of theatrical releases and videogame product.


    Through 27 April, American Sniper grossed over $540 million at the worldwide box office. On 9 April, Warner Bros., its TT Games business and The Lego Group announced Lego Dimensions, a videogame experience that combines physical Lego brick building toys based on multiple franchises, including Warner Bros.’ DC Comics, The Lord of the Rings and The Lego Movie, with interactive console gameplay.


  • Comcast, Time-Warner Cable quash $45 billion merger deal

    Comcast, Time-Warner Cable quash $45 billion merger deal

    BENGALURU: Comcast Corporation’s merger agreement with Time Warner Cable and its transactions agreement with Charter Communications, Inc have been terminated on the back of increasing pressure from regulators. The Time Warner Cable deal was worth $ 45.2 billion.


    Comcast chairman and CEO Brian L. Roberts said, “Today, we move on. Of course, we would have liked to bring our great products to new cities, but we structured this deal so that if the government didn’t agree, we could walk away. Comcast NBCUniversal is a unique company with strong momentum. Throughout this entire process, our employees have kept their eye on the ball and we have had fantastic operating results. I want to thank them and the employees of Time Warner Cable for their tireless efforts. I couldn’t be more proud of this company and I am truly excited for what’s next.”


    Comcast and Charter Communications had announced in April 2014 that the companies had reached an agreement on a series of tax-efficient transactions, whereby the combined Comcast-Time Warner Cable entity, following completion of Comcast’s previously announced merger with Time Warner Cable, would divest systems resulting in a net reduction of approximately 3.9 million video customers. The divestiture was to follow through on Comcast’s willingness to reduce its post-merger managed subscriber total to less than 30 per cent of total nationalmultichannel video programming distributor (MVPD) subscribers, while maintaining the compelling strategic and financial rationale of its proposed merger with Time Warner Cable. With the merger between the two companies called off, the Charter Communications deal is also off.


    Time Warner Cable and Comcast Corporation mutually agreed to terminate their merger agreement. 


    In an official statement, Time Warner Cable chairman and CEO Robert D. Marcus said, “We have always believed that Time Warner Cable is a one-of-a-kind asset. We are strong and getting stronger. Throughout this process, we’ve been laser focused on executing our operating plan and investing in our plant, products and people to deliver great experiences to our customers. Through our strong operational execution and smart capital allocation, we are confident we will continue to create significant value for shareholders. I’m extremely proud of the professionalism, dedication and resiliency our 55,000 employees have shown over the past year and thank them for their continued commitment to Time Warner Cable.”