Connect with us
MUMBAI: Weeks after the ‘Game of Thrones’ episode leaks admitted by an Indian technology company — a Star India partner, another data leak is being blamed...
BENGALURU: Charter Communications, Inc (Charter) reported quarter-on-quarter (QoQ) net addition of 29,000 residential video subscribers for the quarter ended 31 December, 2015 (Q4-2015, current quarter). Last...
BENGALURU: Charter Communications, Inc (Charter) reported quarter-on-quarter (QoQ) net addition of 29,000 residential video subscribers for the quarter ended 31 December, 2015 (Q4-2015, current quarter). Last...
BENGALURU: Like in the previous two quarters and even earlier, the cable industry in the US continues to bleed video subscribers, albeit slower than before, while internet and business services (BS)...

MUMBAI: Digital services company TO THE NEW Digital, has made a mark in the digital ecosystem with Fortune 500 clients like Sony, P & G, Airbus, Time...

MUMBAI: Dish Network Corporation has filed a reply with the Federal Communications Commission (FCC) countering arguments made by Charter Communications, Inc. (Charter), Time Warner Cable, Inc....
BENGALURU: The slide in retail or residential video numbers continues for the US television cable industry, if one were to go by the numbers reported by...

MUMBAI: Federal Judge Terry Hatter has issued a ruling re-opening the $20 billion racial discrimination in contracting lawsuit filed by Entertainment Studios Networks, Inc. and the...

MUMBAI: Federal Judge Terry Hatter issued a short ruling dismissing the $20 billion racial discrimination in contracting lawsuit filed by the National Association of African American...

People often tend to compare the cable television industry in India with that of the US. They say that the industry is headed the US way....

MUMBAI: Time Warner Cable Inc. has named John H. Keib as executive vice present and chief operating officer of residential services. In this role, Keib...
MUMBAI: Octogenarian media baron Rupert Murdoch is all set to resign from his position as 21st Century Fox CEO, handing over the reigns to his son...
MUMBAI: Time Warner Cable Inc executive vice president and chief financial officer Arthur Minson is leaving the company with immediate effect. He will remain as...
MUMBAI: After much speculation, Charter Communications has agreed to acquire Time Warner Cable Inc for a sum of $78.7 billion in cash and stock. With...
MUMBAI: Internet products and services company TO THE NEW Ventures has consolidated its specialized service businesses namely Ignitee Digital, Intelli Grape Software, Tangerine Digital and Techsailor...

MUMBAI: Time Warner Cable has added live TV to its TWC TV app on the Xbox One video game and entertainment system from Microsoft. Time...
BENGALURU: Comcast Corporation’s merger agreement with Time Warner Cable and its transactions agreement with Charter Communications, Inc have been terminated on the back of increasing pressure...
BENGALURU: Time Warner Cable Inc (TWC) reported a 1.1 per cent growth in operating income in FY-2014 at $4632 million from $4580 million in FY-2013. For...
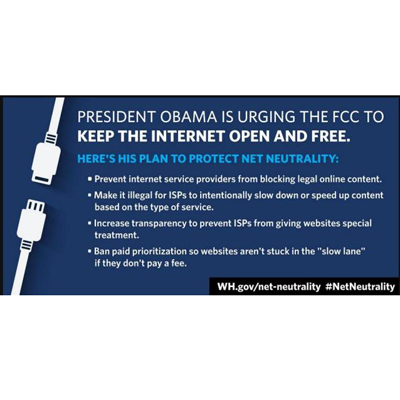
NEW DELHI: President Barack Obama has urged the American telecom regulator Federal Communications Commission (FCC) to keep the internet open and free. But this plea...

BENGALURU: Comcast Corporation (Comcast) announced yesterday that, at its special meeting of shareholders held at The Kimmel Centre for The Performing Arts in Philadelphia, more than...

NEW DELHI: Time Warner Cable Business Class (TWCBC), a provider of communication services for enterprises, is to offer its free Wi-Fi hotspot solution to their business...

MUMBAI: Hungry for expansion outside of India, one of India’s leading English news channels has grabbed a space on the coveted Time Warner Cable (TWC) in...

NEW DELHI: American telecom service provider AT&T and The Chernin Group are acquiring, launching and investing in video services. It is understood that this will be more...
MUMBAI: Comcast Corporation, the largest video, high-speed internet and phone services provider in the US, will acquire its competitor Time Warner Cable for $45.2 billion in...

MUMBAI: The American broadcasting company, ABC, has announced that it will start restricting access to complete episodes of new TV shows to customers of pay TV...

MUMBAI: Time Warner Cable (TWC) has agreed to pay a $1.9 million civil penalty to settle the Federal Trade Commission (FTC) charges as it allegedly violated...
MUMBAI: Time Warner Cable and Comcast Corp are likely to close an acquisition deal that could be worth $58 billion. It is learnt that the duo...
MUMBAI: Charter Communications launched its first mobile TV streaming app on Tuesday, offering a lineup of more than 100 live TV channels in the home, though...

MUMBAI: Charter Communications launched its first mobile TV streaming app on Tuesday, offering a lineup of more than 100 live TV channels in the home, though...
MUMBAI: Apple and Microsoft have added new channels to their streaming video devices that boost their available content. It’s a step forward for both gadgets but...

MUMBAI: As Time Warner Cable and CBS continue their negotiating deadlock, Starcom MediaVest researcher Sam Armando has discovered how widespread the blackouts are individually in the...
MUMBAI: Apple and Microsoft have added new channels to their streaming video devices that boost their available content. It’s a step forward for both gadgets but doesn’t break the...
MUMBAI: Time Warner Cable is trying out a traditional solution to its longstanding CBS blackout problem. The cable operator has started offering free television antennas to...
MUMBAI: According to recently released FCC data from their annual report on cable industry competition, the cable industry lost roughly 2.5 million video subscribers between 2010...
NEW DELHI: Comcast Cable and Time Warner Cable have joined hands to manage the Reference Design Kit (RDK) software being used in set-top boxes (STBs). The...
MUMBAI: Cox Communications, the third-largest US cable provider, has held talks about combining with Charter Communications, according to reports on the matter. Cox president Pat Esser...
MUMBAI: Although neither side is taking shots at each other publicly, there is an undercurrent of tension between Time Warner Cable (TWC) and CBS Corp as...

NEW DELHI: Time Warner Cable (TWC) has made available its TWC TV application on compatible Samsung Smart TVs to enable customers to see television without a...
MUMBAI: Tivo which develops digital video recorders in the US has settled its pending patent litigation with Motorola (now owned by Google and Arris), Cisco and...

MUMBAI: The Time Warner Cable (TWC) TV mobile app for iOS devices received an upgrade that now allows users to watch from anywhere some of the...

MUMBAI: Time Warner Cable has launched TWC TV channel on Roku players. Customers will be able to stream up to 300 channels of live programming in...

MUMBAI: SnagFilms, one of the world‘s leading distributors of independent films for digital platforms, has released its groundbreaking feature documentary Confessions Of An Eco-Terrorist on the...

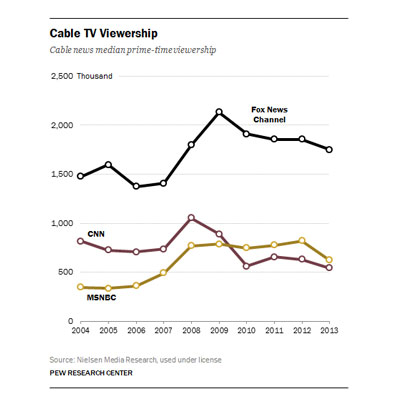
MUMBAI: News Corp will look for higher programming fees in the upcoming negotiations with pay TV contributors for its Fox News channel. News Corp COO Chase...

MUMBAI: US cable television company Adelphia Communications Corporation has completed the sale of all of its assets to Time Warner Cable and Comcast Corporation for the...

MUMBAI: OpenTV Corp. a provider of enabling technologies for advanced digital television services has announced a multi-year license agreement with Time Warner Cable to deploy the...
MUMBAI: US media conglomerate Viacom’s subsidiary Bet is launching a jazz channel Bet J. Bet has signed a deal with US pay-TV platform DirecTV for carriage....
MUMBAI: NBC Universal has formed a new business unit, the Technology Growth Center (TGC), within the media giant to focus on new business opportunities in digital...
MUMBAI: Investor Carl C. Icahn and Time Warner Inc announced that they have reached an agreement regarding specific actions the company will take to improve its...
MUMBAI: US cable firm Comcast in conjunction with fitness expert Jake Steinfeld and equity partners New Balance and Time Warner Cable, has launched Exercise TV. This...
MUMBAI: NBC Universal’s new network Sleuth has announced carriage deals with satellite platforms DirecTV and Dish Network this summer. Sleuth, the 24-hour crime, mystery and suspense...


