Connect with us
MUMBAI: The battle for Bihar in 2020 wasn’t just fought on dusty village squares and opposition rallies. It raged across television screens and newspaper columns, with...
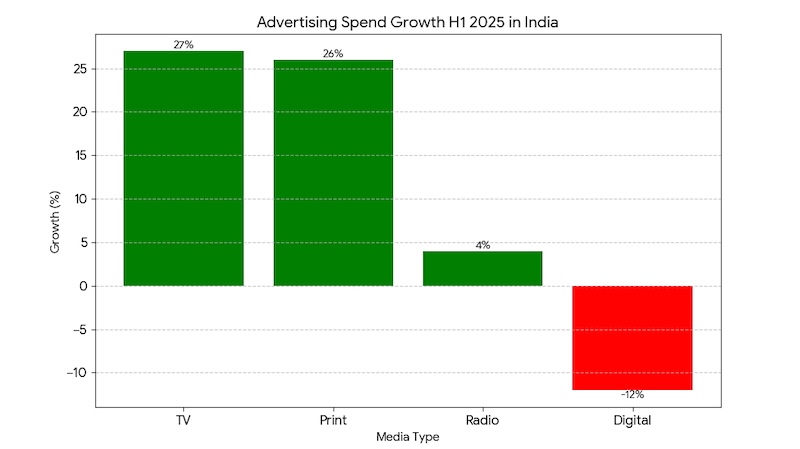
MUMBAI: Here’s one report which is not talking of doom and gloom as far as ad spends in India are concerned. India’s advertising market kicked off...
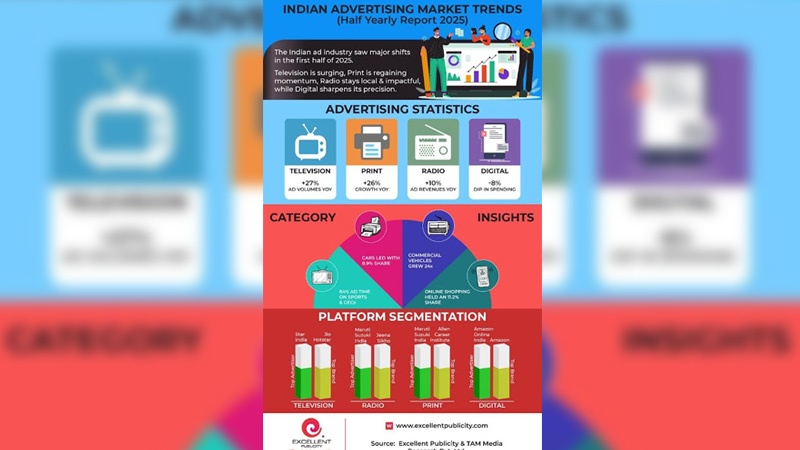
MUMBAI: Lights, camera, action, India’s advertising pie in 2025 is anything but half-baked. The first half of the year has seen TV, radio, and print rise...
MUMBAI: India’s television advertising market has hit the brakes. Ad volumes per channel tumbled 10 per cent in the first half of 2025 compared with the...
Mumbai: As the election season approaches, the advertising landscape witnessed a surge in activity, especially across traditional mediums like TV, print, and radio. A recent report...

Mumbai: TAM AdEx has released a quarterly report on television advertising for Jul – Sep’23. Ad volumes on television advertising witnessed growth of five per cent...

Mumbai: TAM Sports has released an advertising report based on the first 39 matches of ICC CW’23 and for all the channels on which matches are...

Mumbai: TAM Sports has released an advertising report based on the first 31 matches of ICC Men’s Cricket World Cup’23 and for all the channels on...

Mumbai: TAM Sports has released an advertising report based on the first 23 matches of ICC Men’s Cricket World Cup’23 and for all the channels on...

Mumbai: TAM India has released a half-yearly report for advertising in Banking Finance Investments(BFSI). Ad volumes’ trend for BFSI on TV: The BFSI sector’s ad volumes...

Mumbai: The recently released TAM AdEx Report throws light on the advertising taken up by the FMCG sector for the period Jan-Jun’23, in the four mediums...

Mumbai: TAM AdEx has released its half-yearly report for advertising in the movie genre for the period Jan-Jun’ 23. As per the ad volume trends of...

Mumbai: TAM AdEx has released its half-yearly report on Celebrity Endorsement from January – June’ 23. According to the report, in Jan-Jun’23, 28 per cent share...

Mumbai: TAM AdEx has released its half-yearly report on Celebrity Endorsement from January – June’ 23. According to the report, in Jan-Jun’23, 28 per cent share...
Mumbai: In comparison to January-September 2021, the personal healthcare sector’s ad volume trend witnessed a two per cent rise in television during the same period in...
Mumbai: On Wednesday, TAM AdEx released a television advertising quarterly report from July to September 2022. According to the report, the TV ad volume increased by...
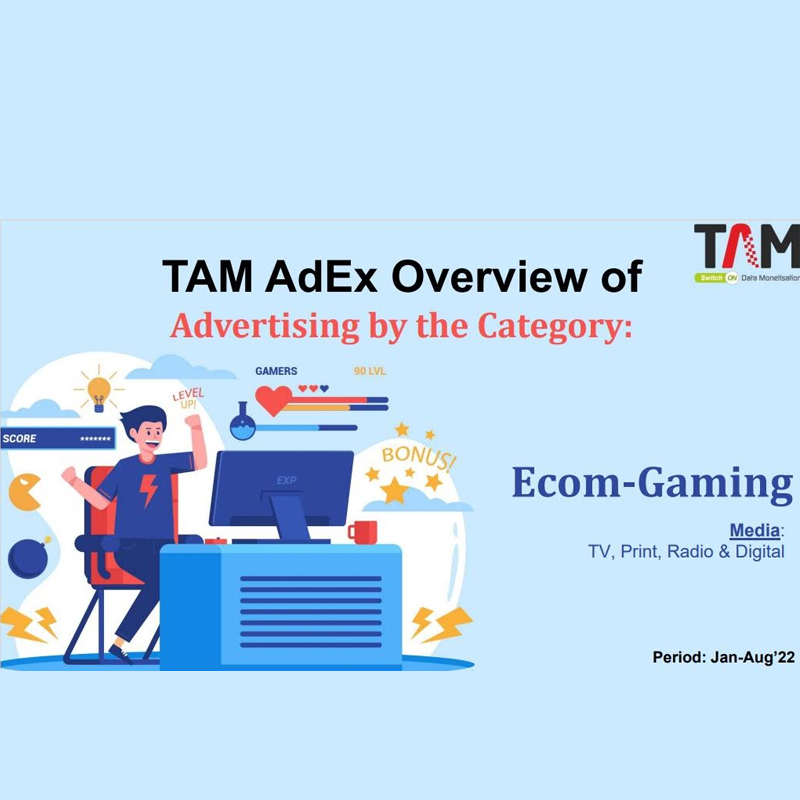
Mumbai: TAM AdEx has released an e-commerce-gaming cross-media report for January to August 2022, highlighting the advertising volumes of all mediums (television, print, radio, and digital)...
Mumbai: The total advertising volumes on television grew two-fold in May 2022 compared to the same period in 2020(May 2020), according to the latest report by...
Mumbai: TV, radio and digital witnessed recorded massive growth in ad volumes, however, print media lagged behind in the race, according to TAM AdEx Report that...

Mumbai: TV advertising volumes for retail outlets – jewellers grew by 52 per cent in January-August 2021 over the same period in the previous year, according...

Mumbai: The advertising volumes for laptop/notebook category dipped by four per cent in January-August 2021 compared to the same period in 2020, according to TAM Media...

MUMBAI: The TAM Adex overview of advertising in the personal care and hygiene sector across TV, print, radio and digital media for the year 2020 has...

MUMBAI: 2020 was a difficult year for the television broadcast space, courtesy Covid2019 pandemic. Every genre struggled hard to ensure saliency in terms of content generation...

NEW DELHI: Holding the highest share of regional ad volumes at 16 per cent in Covid times, as highlighted in the TAM AdEx data released recently,...

NEW DELHI: It seems that print media will soon be back on track as print advertising registered 325 per cent rise in average ad volume per...
NEW DELHI: Battling through a rough quarter with, television advertising is once again gaining momentum. As per a recent TAM AdEx data, the month of June...

NEW DELHI: The third biggest contributor to south India’s ad space, amounting to Rs 5,000 crore in the year 2019 (as per TAM AdEx South Side...

MUMBAI: Personal Care/Personal Hygiene products became the top sector to advertise on Indian television in the second quarter of 2019, recording a growth of 23 per...

MUMBAI: A total of 450+ categories, 6400+ advertisers, and 8500+ brands advertised across mediums (TV, print, and radio) during the festive period of Ganesh Chaturthi (22...

MUMBAI: Personal car and personal hygiene sector saw a dip in ad volumes at the onset of festive season during Ganesh Chaturthi and Onam, as revealed...

MUMBAI: TV ad volumes saw an indexed increase of 10 per cent in Q2-19 as compared to Q1-19, a recent TAM AdEx data report reveals. Personal...

MUMBAI: While the ad volumes on kids channel and sports channel saw marginal increase in Q1’19 as compared to the corresponding quarter of the previous year,...

MUMBAI: For almost three decades, TV has remained the preferred choice for political parties to advertise during the poll seasons, given its mass outreach. However, despite...

MUMBAI: TAM Media Research – a joint venture between global media research organisations, Nielsen and Kantar has released the very first and one-of-its-kind, comprehensive go-to-market AdEx study...

MUMBAI: Recently released TAM Media Research AdEx data reveals that Samsung India Electronics was the top advertiser in the telecom products category on print, radio, and digital...

Highlights: • Food & Beverage Sector Advertising on TV witnessed 7% Ad Volume growth during Jan- Jun 2013 in comparison with Ad Volumes in Jan...
MUMBAI: Bharti Airtel has cut down its advertising on television and shifted allocations to other mediums in 2012, a year marked by slowdown and a difficult...

“Measuring the pulse of Indian TV audiences” – one sees these words almost everywhere in the Mumbai headquarters of TAM India. With services in more than...