Tag: Parijat Chakraborty

  • Two in three Indians claim to be happy in August 2024: Ipsos IndiaBus Happiness Monitor

    Two in three Indians claim to be happy in August 2024: Ipsos IndiaBus Happiness Monitor

    Mumbai: Ipsos IndiaBus Happiness Monitor maps happiness quotient of Indians along the length and breadth of the country, across target groups, cohorts and demographics shows, largely Indians are a happy bunch. The torrid times notwithstanding, with extreme weather flare-ups and impact of rising cost of living, two in three Indians (65 per cent) claim to be happy in August 2024, though there has been a significant drop in happiness consecutively for two months: minus five per cent in Aug and previously of minus five per cent drop in July.  

    Citizens of the west zone (88 per cent), tier one (85 per cent), metros (74 per cent), the north zone (73 per cent), SEC A (72 per cent), tier 2 (70 per cent), high education (68 per cent), employed – part time/ full time (68 per cent), females (67 per cent), 18minus 30 years (67 per cent), full time parents/ homemakers (66 per cent), students/ pupils (65 per cent), 45 plus age group (65 per cent), SEC B (65 per cent), 31 minus 45 years (64 per cent), males (64 per cent), low education (64 per cent) were seen to be the happiest. Citizens in tier three (43 per cent), the east zone (44 per cent) and the south zone (46 per cent) reported lowest happiness levels.

    Elucidating on the findings of the survey, group service line leader, public affairs, corporate reputation, ESG and CSR – Parijat Chakraborty said, “Prima facie, while there is a significant dip in happiness levels from July, let’s not miss the woods for the trees – majority of Indians are in a happy state of mind, though the monsoon has wreaked havoc and adversely impacted several regions of India. We also see blips of dip in happiness levels across demographics, but once again majority of our citizens polled claim to be happy. The tragic rape and murder of a young doctor in Kolkata and the unrest in Manipur has seen happiness levels drop by minus 21 per cent in the East zone. Natural calamities have impacted  the southern region and the lower strata of society. On the other hand happiness has surged for the metros, tier1 cities and the west zone.”  

    Biggest contributors to happiness

    The survey further delved deeper to understand some of the areas that added most to happiness. Though we see dip around all of them compared to the previous month, but their contribution to happiness was seen to be immense. The trend chart shows the trend line across all attributes.

    Biggest contributors to happiness

    Family (73 per cent) continues to be the biggest source of happiness in August 2024, followed by health (65 per cent), friends’ circle (65 per cent), colleagues/ business associates, employer or work (64 per cent) and neighbours (57 per cent) etc. Further happiness also depended on macro minus situations impacting the psyche of citizens. For instance, economic and financial conditions (53 per cent), situation in the country (53 per cent) and the situation in the world (49 per cent). All three areas have seen a significant decline in happiness of minus six per cent, minus 4 per cent and minus 4 per cent respectively.

    “Happiness isn’t just a state of mind. The Ipsos IndiaBus Happiness Monitor, month minus on minus month highlights the areas that drive happiness and depending on a plethora of areas and being defined by close family ties, personal well being, social fabric, work situation and colleagues; one’s economic and financial condition has a significant bearing on happiness and likewise the macro areas of situation in the country and the world. Global turbulence or violence in the country can upset citizens and likewise financial squeeze, after all it is often said, money can buy happiness. Definitely retail therapy elevates happiness, likewise discretionary spends are done when the immediate economic needs are met, like eating out, shopping etc,” added Chakraborty.    

    The chart below shows happiness has yominus yoed over the months. But a minor dip here and there does not take away the significant contribution each area is making to drive happiness. 

    happiness

    The Ipsos IndiaBus Happiness Monitor is a monthly, pan India omnibus (which also runs multiple client surveys), that uses a structured questionnaire and is conducted by Ipsos India on diverse topics among 2200+ respondents from SEC A, B and C households, covering adults of both genders from all four zones in the country. The survey is conducted in metros, tier one, two and tier three towns, providing a more robust and representative view of urban Indians. The respondents were polled face to face and online. There is city minus level quota for each demographic segment that ensures the waves are identical with no additional sampling error. The data is weighted by demographics and city-minus class population to arrive at national average. Data collection is done every month and the results are calculated on two minus months’ rolling sample.

    Follow Indiantelevision.com on WhatsApp channel for the latest updates: https://whatsapp.com/channel/0029VaiosNqGE56fCGRIuX1Z

  • 77 per cent citizens report high happiness levels in June 2024: Ipsos IndiaBus Happiness Monitor

    77 per cent citizens report high happiness levels in June 2024: Ipsos IndiaBus Happiness Monitor

    Mumbai: How happy were Indians in June 2024? More happy or less? Interestingly, overall happiness levels have stayed constant and high in June wave at 77 per cent, like the previous month.

    June wave shows that the cities and cohorts most happy were tier1 (88 per cent), east zone(85 per cent), north zone (84 per cent) and west zone (83 per cent) citizens; full time parents and homemakers (83 per cent), 45 plus age group (81 per cent), low education citizens (80 per cent), females (79 per cent), SEC A (78 per cent), SEC C (78 per cent), SEC B (77 per cent), males (76 per cent), employed – part time/ full time (78 per cent), tier 2 (76 per cent), 18-30 years (77 per cent) and 31-45 years (76 per cent), high education (74 per cent) among others.

    Citizens dwelling in non-metros were happier (80 per cent) vis-à-vis those residing in the metros (71 per cent).

    South zone residents continued to be the least happy, at 56 per cent. Do they feel excluded?

    These are the findings of the Ipsos IndiaBus Happiness Survey, that is the monthly barometer of happiness of urban Indians.

    Commenting on the findings of the survey, group service line leader, public affairs, corporate reputation, ESG and CSR Parijat Chakraborty said, “Largely, majority of Indians are happy, across cities, cohorts and age groups. For a growing, emerging market like India, it is understandable as people are happy and filled with hope and aspirations and are driven. Monsoons in several parts of the country could have worked as a mood elevator, amplifying happiness; more so after a hot and prolonged summer season. And non metros are seeing a lot of improvement in infrastrucure, with a manageable cost of living, making it conducive for the citizens to lead a comfortable life and be joyful.”

    “Full time parents/ homemakers seem the happiest across all cohorts – spending time with children as they have their holidays and family, socializing/ outings and binge watching OTT at home, could be other reasons for their elevated happiness levels,” added Chakraborty.

    Further, the survey showed, that in the June wave, urban Indians were the happiest about family (77 per cent) (minus two per cent), health (72 per cent) (minus two per cent), friends’ circle (70 per cent) (minus two per cent), economic conditions (66 per cent) (plus two per cent), colleagues/ business associates (68 per cent) (plus two per cent), employment/ work (65 per cent) (=), neighbours (65 per cent) (plus one), situation of the country (62 per cent) (minus one per cent), situation of the world 58 per cent (=).

    “Happiness is not just a fleeting feeling. Different aspects of our daily life have a bearing on happiness and it manifests in our relationships, wellbeing, social network, work and other key areas,” said Chakraborty.
     

  • Market Research Society of India elects new managing committee

    Market Research Society of India elects new managing committee

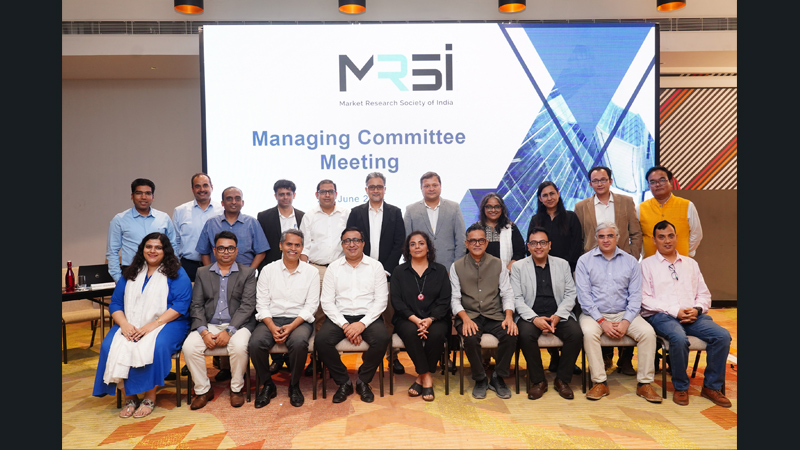
    Mumbai: Market Research Society of India (MRSI), India’s foremost industry-led market research body today announces the formation of the Managing Committee for the tenure of 2024-2027. TAM Media Research Pvt. Ltd. chief growth & partnerships officer Nitin Kamat was elected as the new President and takes over from Kantar managing director, South Asia, Insights Division,Pari Minocha. Nitin worked as the treasurer for MRSI’s Managing Committee 2022-2024. He was also part of the MRSI’s ISEC Committee.

    Additionally, Puneet Avasthi and Shuvadip Banerjee were elected as vice-presidents, Anila Vinayak as the secretary, and Parijat Chakraborty as the treasurer for MRSI. The new Managing Committee was announced at MRSI’s 36th Annual General Meeting held on 27 June 2024 in Mumbai.

    MRSI’s Managing Committee is represented by companies across Research Agencies, Research Users and Service Providers in the market research industry. The newly elected Managing Committee continues to stay committed to promote, protect, improve and propagate the highest quality standards in all branches of market research, thereby establishing India as a dominant force in the global market research industry. For the next couple of years, MRSI aims to capitalize on its recent successes while fostering a more collaborative network for its members, resulting in effective knowledge and resource sharing. Additionally, MRSI will continue to develop the next generation of market research professionals and instil a deep sense of pride in the impactful work being done by the Indian market research industry.

    Congratulating the newly elected president, Minocha said, “I am grateful for the unwavering trust MRSI members placed in the current Managing Committee. Key initiatives like the launch of the Socio-economic Classification System, ‘ISEC’, and the Market Sizing report of FY 2022-23, have given a new direction and scale to the vision of the association going forward. As I pass on the baton, I wish the incoming Managing Committee under the leadership of Nitin Kamat all the best.”

    Soon after its inception, the former Managing Committee adopted the strategy of focusing on three broad pillars- building Profile, building Pride and building the Network and reach. The committee was responsible for the successful implementation and adoption of the new Socio-economic Classification System, ‘ISEC’. Among the various industry stakeholders that adopted ISEC are The Indian Society of Advertisers (ISA), research users of various organisations such as ITC, HUL, Marico, Dabur India, etc., research agencies including Kantar, IPSOS, as well as key media agencies. Additionally, MRSI also indicated that the market research sector, once again recorded positive growth, and will formally announce The Indian Research & Insights Industry 2024 Update in September 2024.

    On being announced as the newly elected president of MRSI, Kamat said, “I am honoured to take forward the role of MRSI President. The market research industry has seen a seismic shift, making it crucial to stay ahead of the curve. My focus will be to engage new minds, to not only maintain existing standards but also implement a new set of ideas and initiatives. In addition to building MRSI’s 3 Pillars – Profile, Pride, and Network, I firmly believe, ‘Building Trust’ is another crucial pillar that we will work upon. I look forward to strengthening global connects, deepening government connects and driving more initiatives for active participation from regional players. I am confident of achieving these goals along with the new elected managing committee members.”

    MRSI’s Managing Committee for the term of 2024-2027

    Sr. No 

    Name 

    Organization 
    1

    Abhinav Goel

    Nestle India

    2

    Amitabh Mishra

    Dr. Reddy’s Laboratories

    3

    Anila Vinayak

    Hindustan Unilever Limited

    4

    Ankit Dhanuka

    Robas Research

    5

    Arindam Bhattacharya

    Lucid (A Cint Group Company)

    6

    Dixit Chanana

    Toluna | MetrixLab – India

    7

    Geetika Kambli

    Future Factory

    8

    Girish Upadhyay

    Axis My India

    9

    Nandita Singh

    Purple Audacity

    10

    Nitin Kamat

    TAM Media Research Pvt. Ltd.

    11

    Parijat Chakraborty

    Ipsos Research Pvt. Ltd.

    12

    Paru Minocha

    Kantar
    13

    Prashant Kolleri

    NielsenIQ India Pvt. Ltd

    14

    Preet Doshi

    Amazon India

    15

    Puneet Avasthi

    Kantar

    16

    Sathyamurthy Namakkal

    AIMO Marketing Services LLP (DataPOEM)

    17

    Saurabh Aggarwal

    Knowledge Excel

    18

    Saurin Shah

    Godrej Consumer Products Ltd

    19

    Shuvadip Banerjee

    ITC Limited

    20

    Vishal Anam

    Datamatics
    21

    Vivek Malhotra

    TV Today Network Ltd.

  • PM Modi gets 70 per cent approval rating despite slight dip in May 2024: Ipsos IndiaBus PM’s Approval Rating

    PM Modi gets 70 per cent approval rating despite slight dip in May 2024: Ipsos IndiaBus PM’s Approval Rating

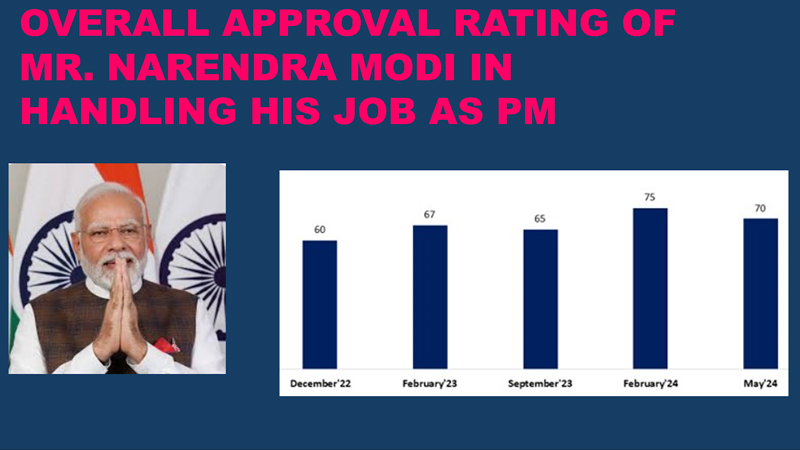
    Mumbai: Narendra Modi has been voted back to power in the general elections as the PM of the country and on 9 June 2024, took oath as the PM of the country. Interestingly, Modi being high on the popularity sweepstakes is ratified by the Ipsos Approval Rating of the PM, carried out in May 2024, where he scored 70 per cent for his performance as the PM of the country. Though there has been a five  per cent dip over the last round of the Ipsos survey conducted in February 2024, yet, majority of citizens polled believe Modi is doing a good job as the PM, as opposed to the naysayers, who were far and few.    

    Interestingly, Modi’s approval rating was seen to be high across different cohorts and cities: Citizens of north zone (86 per cent), tier1 (85 per cent) and east zone (83 per cent) gave Modi a distinction in performance as PM. He was further rated high on performance by full time parents/ homemakers (79 per cent), tier3 cities (76 per cent), 45-plus age group (75 per cent), west zone (75 per cent), low education citizens (73 per cent), females (72 per cent), 18-30-year-olds (71 per cent), SEC B (71 per cent), employed part time/ full time (71 per cent), SEC A (69 per cent), SEC C (69 per cent), males (68 per cent), 31-45 years (66 per cent), high education (65 per cent), students/ pupils (62 per cent) and tier2 (60 per cent).

    His approval rating was relatively lower for metros (53 per cent), self employed (43 per cent) and south zone (31 per cent). 52 per cent disapproved in south zone.

    Performance of Modi government on key issues

    What were the hits and misses of the Modi government? The survey also gauged the performance of the government on some of the key portfolios. Education system, sanitation and cleanliness and healthcare emerged the top performance areas. Pollution and environment, poverty, inflation and corruption were the middle of the road performance areas. While unemployment was rated lowest in performance.

    Areas

    Performance April ‘24

    Performance May ‘24

    1

    Education System

    76 per cent

    2

    Sanitation & Cleanliness

    67 per cent

    3

    Healthcare System

    64 per cent

    4

    Pollution and Environment

    56 per cent

    5

    Poverty

    45 per cent

    6

    Inflation

    44 per cent

    7

    Unemployment

    43 per cent

    8

    Corruption

    42 per cent

    Ipsos India group service line leader, public affairs, corporate reputation, ESG & CSR, Parijat Chakraborty said, “PM Modi has been elected for the third term as the PM of the country and that gets validated in our approval rating for the PM carried out in May 2024, which gives him a high rating of 70 per cent on his performance. Though there has been a five  per cent dip from last round, Modi continues to be popular among the masses as their leader to steer the country The poll lauds his work particularly in the areas of education, sanitation and cleanliness and healthcare. In some areas the views were polarized on his performance. Particularly, for pollution, poverty, inflation, corruption and unemployment.”  

    Methodology:

    Ipsos IndiaBus is a monthly pan India omnibus (which also runs multiple client surveys), that uses a structured questionnaire and is conducted by Ipsos India on diverse topics among 2200+ respondents from SEC A, B and C households, covering adults of both genders from all four zones in the country. The survey is conducted in metros, tier 1, tier 2 and tier 3 towns, providing a more robust and representative view of urban Indians. The respondents were polled face to face and online. We have city-level quota for each demographic segments that ensure the waves are identical and no additional sampling error. The data is weighted by demographics and city-class population to arrive at national average.

  • Excitement high among cricket enthusiasts this IPL: Ipsos IndiaBus IPL survey

    Excitement high among cricket enthusiasts this IPL: Ipsos IndiaBus IPL survey

    Mumbai: With the Tata Indian Premier League (IPL) 2024 extravaganza off to a flying start from March 22nd 2024, an Ipsos IndiaBus pan India IPL Survey shows at least 1 in 2 urban Indians polled (53 per cent) claim to be following the sporting event. Men’s T-20 annual sporting event in its 17th year, has a run of about 60 days, making it a highly engaging event for cricket lovers.

    Interestingly, more males (67 per cent) claimed to be following the event vis-à-vis females (38 per cent). Though there was not much difference seen across age bands and their interest in the game – 18-30 years (56 per cent), 31-45 years (56 per cent) and 45+ (45 per cent) claimed to be following the IPL.

    Excitement with IPL

    The IPL has struck a chord with the cricket enthusiasts with 88 per cent of those polled (and following the IPL) claiming to be excited about the annual sporting event.

    The excitement was palpable across demographics to the same extent, though among a few cohorts it was a lot higher, particularly the south zone (96 per cent), north zone (93 per cent), metros (91 per cent), tier 2 (92 per cent), tier 3 (95 per cent), high education (92 per cent), self-employed (95 per cent) and 45+ age group (92 per cent).

    Commenting on the findings of the Ipsos IndiaBus IPL Survey, Ipsos India Group Service Line Leader Public Affairs, Corporate Reputation, CSR and ESG Parijat Chakraborty said, “Tata IPL 2024 is this big, 60 day annual big treat for cricket enthusiasts, which has a heady mix of great batting and bowling order – also captured under orange and purple caps – best of cricket, world class players unleashing their prowess under pressure and the short format of cricket, creating a high level of engagement and excitement around this annual fiesta. The stakes are high, and this is one recession proof brand. As the event picks up, those following the game are likely to increase.”    

     Where is the IPL being watched?

    Urban Indians who are extremely kicked about the sporting event claimed to be watching the IPL 2024 across different mediums of access – Television (75 per cent), online/ mobile (49 per cent), OTT platforms (20 per cent) and radio (4 per cent).  33 per cent).

    And if we explore deeper, while TV is the most popular medium for watching the game, more number of respondents from north zone (83 per cent), full time parents and homemakers (84 per cent), SEC B (80 per cent), SEC A (78 per cent), 45+ age group (86 per cent), metros (79 per cent), tier1 cities (79 per cent) said they are watching the game on TV.

    Further, those watching the game on their mobile devices, were largely the self-employed (68 per cent), employed – part time or full time (56 per cent), males (57 per cent), 31-45 years (54 per cent), 18–30-year-olds (51 per cent), high education (58 per cent), living in the metros (56 per cent), from south zone (56 per cent) and west zone (55 per cent).

    The game was being watched on OTT more by those belonging to SEC A (44 per cent), metros (34 per cent), high education (32 per cent) and self-employed (33 per cent).  

     And those catching the game on the radio were largely the self-employed (9 per cent), from tier 1 (9 per cent), west zone (8 per cent), SEC A (7 per cent) and women (7 per cent). Males were a miniscule 2 per cent.            

    The survey also explored the psyche of the IPL enthusiasts, to understand from them the motivations for liking the IPL so much. There is so much noise and chatter around this annual spectacle, which also packs in the best of breed and play in Cricket.

    Why is the IPL liked?

    Urban Indians claimed to be liking the IPL for a plethora of reasons – entertainment (64 per cent), T-20 format (47 per cent) and the team format – of world class players (37 per cent).

    Audiences most kicked about the entertainment aspect were the self employed (76 per cent), from east zone (74 per cent), south zone (72 per cent), SEC A (71 per cent), SEC B (64 per cent), men (64 per cent), women (62 per cent), aged 45+ (67 per cent), 18-30 years (64 per cent), 31-45 years (62 per cent) etc.

    T-20 format was most liked by respondents from SEC A (65 per cent), metros (75 per cent), high education (58 per cent), tier1 (52 per cent), tier2 (50 per cent), west zone (53 per cent) and north zone (50 per cent).  

    And those most enthused about the T20 team format were, SEC A (54 per cent), employed (47 per cent), men (40 per cent), high education (45 per cent), tier 1 (52 per cent), metros (42 per cent), tier 2 (41 per cent), east zone (53 per cent) and west zone (45 per cent).  

     “When the IPL made its debut 17 years ago, conceived by the Board of Control for Cricket in India (BCCI), it was a big draw and it continues to be one of the most anticipated annual sporting events. This year there are 10 teams and 74 matches. Also the matches are aired from evening to night, over 3 hours, making it conducive for cricket enthusiasts to watch the game without disruption. With great cricket, cricket legends, Bollywood, music, cheerleaders and toots, the whole experience is now being called Cricketainment. And the BCCI has set up 50 fan parks in different cities of India, to enhance the whole experience for audiences, bringing the game closer to the fans. Fan parks during the weekends have giant size screens, music, subsidized food for cricket fans to enjoy the IPL at another level,“ added Chakraborty.

    “The 10 teams of Delhi Capitals, Kolkata knight Riders, Lucknow Super Giants, Mumbai Indians, Rajasthan Royals, Chennai Super Kings, Gujarat Titans, Punjab Kings, Royal Challengers Bengaluru and Sunrise Hyderabad are playing 74 matches in 13 cities from March 22nd to May 26th, 2024, making it a visual treat for cricket crazy country like India. With defending champions Chennai Super Kings hosting the opening and closing ceremony, there is a keen interest among south zone fans for the game and across cities and cohorts. With free live streaming of the IPL on Star Sports (TV) and Jio Cinema (internet) it will be about excitement, entertainment and eyeballs, as the IPL keeps getting bigger,” stated Chakraborty.                    

    How is the IPL most watched?

    Urban Indians said they mostly watch the game with family (49 per cent), friends (22 per cent), alone (18 per cent) or with colleagues (9 per cent).

    The survey even drilled it down to the cohorts on how they were watching the IPL – those watching with family were largely full-time parents/ homemakers (75 per cent), women (73 per cent), 45+ age group (62 per cent), SEC A (55 per cent), SEC B (54 per cent), north zone (58 per cent), east zone (55 per cent), tier 1 (55 per cent) and metros (51 per cent).

    Those watching with friends were particularly males (29 per cent), SEC C (32 per cent), south zone (41 per cent), east zone (31 per cent), tier 3 (33 per cent), self-employed (32 per cent) etc.

    Those watching alone were males (23 per cent), aged 45+ (23 per cent), employed (24 per cent), tier 2 (26 per cent), north (21 per cent), south (20 per cent) etc.

    Those watching with colleagues, aged 18-30 years (13 per cent), students (14 per cent), tier 1 (17 per cent), west zone (15 per cent), north zone (12 per cent), et al.

    How we did it

    We ran the survey on Ipsos IndiaBus, our monthly pan India omnibus (which also runs multiple client surveys), using a structured questionnaire and is conducted by Ipsos India on diverse topics among 2200+ respondents from SEC A, B and C households, covering adults of both genders from all four zones in the country. The survey is conducted in metros, tier 1, tier 2 and tier 3 towns, providing a more robust and representative view of urban Indians. The respondents were polled face to face and online. We have city-level quota for each demographic segments that ensure the waves are identical and no additional sampling error. The data is weighted by demographics and city-class population to arrive at national average. 

  • 72 per cent urban Indians happy in Circa 2023: Ipsos India happiness report

    72 per cent urban Indians happy in Circa 2023: Ipsos India happiness report

    Mumbai: 20 March marks the UN’s International Day of Happiness with the theme of 2024 being  “Reconnecting for Happiness: Building Resilient Communities.” It’s also the day when Ipsos, a global market research company releases its Ipsos India annual Happiness Report which deep dives into 12 months of a rigorous study to emerge with the true indicators of happiness for 2023.

    Overall, in Circa 2023, 72 per cent per cent Indians claimed to be happy. While the Indians are most happy with family (73 per cent), deeper analyses reveal that personal finance and health are the top influencers of our happiness.

    Ipsos experts ran a regression analysis on the 12 months of happiness data and the derived analysis provided a more nuanced view about what influences happiness and what contributes to happiness.  The analysis further revealed that health and personal finances were the biggest influencers to Happiness for Indians. Family, which we are most happy about, was placed third in the pecking order of the importance hierarchy – far lower in influence as compared to health and personal finances.

    The analysis also revealed, Indians have higher expectations on the financial front. So, while it was an important influencer, the current happiness score of personal finances was much lower, at 55 per cent.

    Interestingly, on the professional front, work and career was seen to play a more significant role in terms of how it affects their finances. The actual work and colleagues had lesser impact on overall happiness.

    “Indians are happy in their own ‘personal bubble’. Their attention is more inward-driven, rather than the external situation of the country and the world. The report captured variations across life stage, location and gender of the individual. For instance, for men, health and personal finances were equal influencers, while for women, health was clearly ahead as a driver to be happy. For those living in metros, health was a bigger influencer than for those in non-metros. An age-wise analysis also revealed the shift in what makes individuals happy – health overtakes finances for those older than 46 years, as compared to the younger generation (where both health and personal finances were equally important),” stated Ipsos India group service line leader, public affairs, corporate reputation, ESG & CSR Parijat Chakraborty.  

    The report, first of its kind in India, is based on the twelve-month data for 2023 from the Ipsos IndiaBus monthly Happiness Monitor. Ipsos IndiaBus is an urban India omnibus, fielded among 2200+ respondents per month from NCCS A, B, and C households, covering adult males/ females across all four zones in the country. The survey is conducted across 16 cities – a mix of metros, tier 1, tier 2, and tier 3 towns, providing a robust and representative view of urban Indians.

    Access full report here

  • 73 per cent urban Indians see Ram Temple consecration boosting BJP/NDA vote bank: Ipsos IndiaBus Ram Temple Perception Poll

    73 per cent urban Indians see Ram Temple consecration boosting BJP/NDA vote bank: Ipsos IndiaBus Ram Temple Perception Poll

    Mumbai: The consecration ceremony of the Ram Temple in Ayodhya was held on 22 January 2024. PM Narendra Modi was present at the temple and about 7,000 devotees including celebrities and prominent figures in society were present, who were there by invitation.

    A lot has been written about the timing of the opening with general elections coming up this year.  What are the views of the common man? Ipsos, a leading global market research conducted a survey among urban Indians to capture their views on how they perceive this grand opening of the temple. Overall, 73 per cent of the respondents polled believe the construction of the Ram Temple in Ayodhya will influence votes in favor of the BJP/ NDA in the upcoming General Elections. Similar views were pronounced among students (80 per cent), east (86 per cent), north (80 per cent), tier 1 (79 per cent), tier 3 (77 per cent), west (74 per cent), women (74 per cent), low education (74 per cent), high education (71 per cent), men (71 per cent), SEC A (69 per cent), tier 2 (62 per cent) and slightly lower among south (51 per cent) respondents.

    Ram Temple in Ayodhya = Economic gains for Uttar Pradesh?

    Overall, 77 per cent of those polled hold the view that the new Ram Temple in Ayodhya will boost economic gains for Uttar Pradesh. Across demographics the respondents polled held this view and agreed. East zone (91 per cent), north zone (89 per cent), west zone (80 per cent), 45 plsu age group (81 per cent), 18-30 years (78 per cent), 31-45 years (73 per cent), SEC B (81 per cent), SEC C (77 per cent), students (81 per cent), males (79 per cent), females (75 per cent) etc. The view was also endorsed by tier 1 (79 per cent), metros (78 per cent),  tier 1 (79 per cent), tier 2 {76 per cent), tier 3 (75 per cent), low profile (79 per cent) and high profile (71 per cent). Only 45 per cent in south felt the temple will lead to economic gains for Uttar Pradesh.  

    Commenting on the findings of the survey, Ipsos India group service line leader, public affairs, corporate reputation, CSR and ESG Parijat Chakraborty said, “The Ram Temple in Ayodhya will influence the vote bank in favour of the BJP/ NDA is the dominant view. This view is being supported by more number of respondents across demographics. For south zone we see polarization of views. Likewise the Ram Temple giving a fillip to economic gains for the state of UP was universally endorsed across cohorts. Only south zone was polarized. New fancy trains, airport, and improved infrastructure in Ayodhya will finitely bring devotees to the holy city and increase tourism and economic benefits.”

    Ram Temple opening – a religious event or political event  

    Overall, we see divided views – 51 per cent perceive it as a religious event; 16 per cent say it is a political event, while 26 per cent believe it is a religious cum political event and seven per cent were undecided.  South zone was most divided with 24 per cent calling it a religious event, 35 per cent said political event, 24 per cent said both (religious and political), while 17 per cent were undecided. 66 per cent respondents in tier 3 called it a religious event and likewise for north zone (65 per cent) said it is a religious event.

    “Perceived largely as a religious event, though its linkage with politics cannot be ignored,” added Chakraborty.

    Methodology:

    Ipsos IndiaBus is a monthly pan India omnibus (which also runs multiple client surveys), that uses a structured questionnaire and is conducted by Ipsos India on diverse topics among 2200 plus respondents from SEC A, B and C households, covering adults of both genders from all four zones in the country. The survey is conducted in metros, Tier 1, Tier 2 and Tier 3 towns, providing a more robust and representative view of urban Indians. The respondents were polled face to face and online. We have a city-level quota for each demographic segments that ensure the waves are identical and no additional sampling error. The data is weighted by demographics and city-class population to arrive at national average.

  • 73 per cent urban Indians believe our system is broken: Ipsos Global Advisor Populism in 2024 Survey

    73 per cent urban Indians believe our system is broken: Ipsos Global Advisor Populism in 2024 Survey

    Mumbai: Circa 2024 is a landmark year for world politics and elections when over four billion people will cast their vote in 70 plus countries.  India too goes to the polls in April-May 2024. Populism, anti-elitism and nativism, a 28-country global advisor study shows at least seven in 10 urban Indians polled (73 per cent) believe our system is broken. Further, there is a sentiment of lack of level playing field with at least 71 per cent urban Indians feeling the economy is rigged to favor the rich and powerful. 54 per cent Indians believe our society is broken. And 54 per cent Indians also believe the country is in decline.

    In fact, the common man seems quite excluded in the complete scheme of things – 72 per cent say traditional parties and politicians do not care about them; while 73 per cent feel experts in the country do not understand their lives and 74 per cent believing political and economic elite don’t care about hardworking people. The grouse of the common man was with the lack of fairness, with 74 per cent of the view that there was a glaring divide in society between the ordinary citizen and the political and economic elite. Similar view was held by citizens of Hungary (80 per cent), South Africa (79 per cent) and France (77 per cent).

    Solution? panacea? 74 per cent citizens believe we need a strong leader who is willing to break the rules, to fix the country and take the country back from the rich and powerful. Urban Indians also had strong views on political discourse with 74 per cent of those polled being of the view that most important political issues in India should be decided directly by the people, through referendums and not by the elected officials. This view was most pronounced in India across all the 28 markets covered in the survey, and some of the other top markets emerging included Thailand (73 per cent), Hungary (69 per cent) and South Korea (69 per cent).    

    Opinion about governments

    Should the government increase taxes to pay for any additional spending? While 40 per cent agreed (highest globally), 32 per cent disagreed, 15 per cent were unsure and 13 per cent neither agreed nor disagreed. Most markets disagreed with increase in taxes to provide govt with additional funds for spending, esp in Hungary (74 per cent), South Africa (72 per cent) and Colombia (68 per cent).

    The survey also factored in views of citizens on what govt should increase their spends on: 63 per cent Indians endorsed increase in spends by govt on infrastructure (roads, bridges, rail and air networks, water, electricity and broadband); 65 per cent citizens want govt to spend more on education (schools, universities, job training); 65 per cent citizens want govt to increase spends on public safety (law enforcement, fire and emergency medical services); 66 per cent citizens want govt to increase spends on defense and national security (e.g. military); 66 per cent of urban Indians want govt to increase spends on creating jobs and 60 per cent  Indians want the govt to increase spends for reducing poverty and social inequality.  

    Summarising on the findings of the survey, CSR & ESG group service line leader, public affairs, corporate reputation Parijat Chakraborty said, “The common man believes the system is broken and society is broken. There is this accentuated feeling that power and privileges rest with the political and the elite and they get a short shrift. And they largely believe the society is divided, between the common citizens and the politicians and the elite. For an emerging, growth oriented market like India, citizens want govt to increase spends on infrastructure, education, public safety, defense and national security, job creation and reducing poverty and social inequality.”        

    Methodology

    These are the results of a 28-country survey conducted by Ipsos on its Global Advisor online platform and, in India, on its IndiaBus platform, between Friday, November 22 and Friday, December 6, 2023. For this survey, Ipsos interviewed a total of 20,630 adults aged 18 years and older in India, 18-74 in Canada, Malaysia, South Africa, Turkey, and the United States, 20-74 in Thailand, 21-74 in Indonesia and Singapore, and 16-74 in all other countries.

    The sample consists of approximately 1,000 individuals each in Australia, Brazil, Canada, France, Germany, Great Britain, Italy, Japan, Spain, and the U.S., and 500 individuals each in Argentina, Belgium, Chile, Colombia, Hungary, Indonesia, Malaysia, Mexico, the Netherlands, Peru, Poland, Singapore, South Africa, South Korea, Sweden, Thailand, and Turkey. The sample in India consists of approximately 2,200 individuals, of whom approximately 1,800 were interviewed face-to-face and 400 were interviewed online.

    Samples in Argentina, Australia, Belgium, Canada, France, Germany, Great Britain, Hungary, Italy, Japan, the Netherlands, Poland, South Korea, Spain, Sweden, and the U.S. can be considered representative of their general adult populations under the age of 75. Samples in Brazil, Chile, Colombia, Indonesia, Malaysia, Mexico, Peru, Philippines, Singapore, South Africa, Thailand, and Turkey are more urban, more educated, and/or more affluent than the general population. The survey results for these countries should be viewed as reflecting the views of the more “connected” segment of their population.

    Some of the analysis refers to a “28-country average”. This reflects the average result for all the countries and markets where the survey was conducted. It has not been adjusted to the population size of each country or market and is not intended to suggest a total result.

    India’s sample represents a large subset of its urban population — social economic classes A, B and C in metros and tier 1-3 town classes across all four zones.

    The data is weighted so that the composition of each country’s sample best reflects the demographic profile of the adult population according to the most recent census data. The “28-country average” reflects the average result for all the countries and markets in which the survey was conducted. It has not been adjusted to the population size of each country or market and is not intended to suggest a total result.

    When percentages do not sum up to 100 or the ‘difference’ appears to be +/-1 percentage point more/less than the actual result, this may be due to rounding, multiple responses, or the exclusion of “don’t know” or not stated responses.

    The precision of Ipsos online polls is calculated using a credibility interval with a poll where N=1,000 being accurate to +/- 3.5 percentage points and of where N=500 being accurate to +/- 5.0 percentage points. For more information on Ipsos’ use of credibility intervals, please visit the Ipsos website. The publication of these findings abides by local rules and regulations.

  • 92 per cent of Indians concerned about the environment: Ipsos India sustainability segmentation survey 2024

    92 per cent of Indians concerned about the environment: Ipsos India sustainability segmentation survey 2024

    Mumbai: A new survey by Ipsos on sustainability, in the backdrop of heightened emphasis on ESG and the quest to save the environment from further damage shows deep concern among Indians for the environment with at least 92 per cent of those polled stating they are concerned and further two thirds believing that our planet was at risk.

    Impactful actions – awareness misplaced

    Interestingly, the survey revealed, consumers’ actions while well intended were not the actions needed for greater impact.  7 in 10 claimed to know the actions needed to tackle climate change, but they were wrong.

    Urban Indians held the view that less packaging, buying fewer items and recycling would be the best actions for saving the planet, but they were seen to be low in impact. On the contrary some of the actions perceived to be low in impact by urban Indians, were seen to be the actions most impactful, but awareness and the implications of those actions had low perception among Indians, particularly for living car free, efficient cooking and efficient housing. Adopting renewable electricity was high on perception and impact.

    The survey was done using the Ipsos IndiaBus platform, which is a monthly omnibus study, which runs multiple surveys for clients (the details are provided below).

    IPSOS

     Activists, busy bystanders and disengaged denialists segments

    The survey classified Indians among three segments basis their level of concern and actions they are taking to mitigate their impact on environment.

    The largest group of Indians emerged as Busy Bystanders (41 per cent), who held the view that climate change was over blown; they were too caught up in their daily life and environment came out to be a low priority area. The second segment was of Disengaged Denialists (24 per cent), believing environment was not that big a concern and were less inclined to taking any environmental action. And the 3rd segment was of activists (23 per cent), with the belief that environment is at a critical stage and the world must act now.

    Group service line leader, public affairs, corporate reputation, ESG and CSR Parijat Chakraborty said, “Our survey shows that Indians mostly do lip service towards their concern for the planet and the environment. So, while they say they are concerned, when we assessed them on their concern vs actual action, most of them were seen to fizzle out. In fact only the segment of consumers named Activists were the torchbearers of planet saviours. Busy Bystanders and Disengaged Denialists were seen to be the disinterested segments with no affinity for environment actions.”    

    What can marketers do to engage with these three cohorts?

    The survey also revealed insights on how marketers could engage with the three segments of consumers.

    “Given Activists’ high sustainable consciousness, they are best suited for all sustainable brand options and choices. EVs, sustainable clothing and brands with sustainability in their DNA. Disengaged Denialists who were less interested in environment actions could be wooed by providing products with sustainability as a co-benefit. Also by pulling in the sustainability discourse into the things they like or like to do. Busy Bystanders are the working class with sheer paucity of time and also, they carry some bit of guilt of zilch action on environment. So brands that conserve energy, use recycled packaging or local sourced ingredients will appeal to this cohort,” stated Ipsos India executive director Deepti Chandna.

  • 70 per cent of urban Indians feel wedding expenses are excessive: Ipsos study

    70 per cent of urban Indians feel wedding expenses are excessive: Ipsos study

    Mumbai: Weddings abound in India in December. There are an estimated 32 lac weddings in India around that time. Wedding celebrations are rarely muted in India. They are largely big, magnified celebrations extending over days. Ipsos, a global market research company conducted a study among citizens across demographics and towns to understand views and perceptions around weddings. The study titled Ipsos IndiaBus Views on Wedding,  shows at least 7 in 10 urban Indians believe we spend too much on weddings. Interestingly, more number of men polled (75 per cent) held this view vis-à-vis women (72 per cent). Moreover, citizens residing in the metros (80 per cent), tier1 towns (75 per cent), east zone (78 per cent), south zone (75 per cent) and north zone (74 per cent) and 91 per cent of Others (comprising retired, military and those who preferred not to answer) too felt we tend to expend a lot during weddings.

    Is it important to have a big-budget, opulent wedding in India?

    Surprisingly, we received mixed views from the urban citizens. Interestingly, 4 in 10 (43 per cent) citizens endorsed big fat weddings, believing them to be a part of our tradition and celebration; 36 per cent felt big budget weddings are somewhat important as they have a cultural significance, but not essential; while 2 in 10 (21 per cent) of citizens polled, perceived big budget weddings to be unimportant, unnecessary and wasteful. 73 per cent of citizens in the east zone endorsed big, fat weddings believing it to be a significant part of our tradition and celebration. And 49 per cent of citizens in the south zone somewhat supported a grand wedding as it is intrinsic to our culture, at the same time they felt it was not essential or compulsory.

    The rationale for hosting opulent weddings

    Citizens had varied perceptions on why we spend so much during weddings: 43 per cent believed due to the tradition and cultural values; 29 per cent felt for showcasing wealth and status; 12 per cent said due to social pressure and expectations;  11 per cent felt maybe due to the innate desire for creating a lifetime memorable experience; and five per cent felt it was the influence of social media and celebrity culture that was making citizens dole out big budgets during weddings (to copy them). Citizens in the east zone (72 per cent) and tier 3 (62 per cent) felt it was important to spend more money during weddings as it was a part of our tradition and cultural values. These towns are also steeped in traditions and tend to adhere to societal norms. Though for 40 per cent of citizens in the north zone, 39 per cent in the south zone and 38 per cent in tier-two cities, the predominant view was that big-budget weddings were more for the display of wealth and status.

    Delving deeper into the big fat wedding culture, the survey tried to unearth whether a big-budget wedding equals a successful marriage. We found the views were quite divided, with 45 per cent disagreeing, 27 per cent agreeing to a large extent and 27 per cent agreeing to some extent. Differences in views were quite glaring. Those disagreeing most were largely from tier two towns (55 per cent), the north zone (55 per cent), metros (53 per cent) and the unemployed (61 per cent). Those agreeing most were from the east zone (78 per cent) and tier three towns (67 per cent), men (55 per cent) and women (54 per cent).

    We also probed if it was considered financially responsible, to spend a large portion of one’s lifetime savings on a wedding.

    The views were divided. 32 per cent agreed, believing, it is once in a lifetime event and worth the investment; 27 per cent disagreed believing there were better ways to allocate savings for the future; 21 per cent were unsure; while 19 per cent felt it depended on the individual’s financial status.  East zone was seen to be more about display – 65 per cent felt it was once in a lifetime event and worth the investment. While 48 per cent in the south zone were unsure.

    Wedding finances – the best approach  

    Weddings in India are rarely solemnised over a small ceremony, with a handful of close relatives – that happened only during the COVID-19 pandemic and we for the first time witnessed most relatives and friends joining virtually. Weddings in India are largely an elaborate affair with ceremonies, and traditions being followed, and the invitee list expanded to include family, relatives, and friends. This means one needs to fork out large sums of money to cater to the requirements of all ceremonies and meals and decorations, venue hiring etc. What are the best approaches to financing a wedding?  

    The respondents chose multiple options instead of just one. 56 per cent advocated equal sharing of costs between the bride and the groom for wedding finances; at the same 52 per cent of the respondents were of the view that wedding costs should not put undue pressure; and 13 per cent recommended taking a loan or selling investments for financing a wedding.

    Views by cities and cohorts were quite interesting. West zone (72 per cent), east zone (66 per cent), people living in the metros (65 per cent), full-time parents/ homemakers (62 per cent), students (61 per cent), SEC A (61 per cent), employed full-time or part-time (60 per cent) were all of the views that wedding costs should be shared equally between the bride and the groom; While 69 per cent self-employed, 65 per cent in tier three cities, 58 per cent in north zone, 57 per cent in south zone and 54 per cent in east zone were of the view that wedding cost should not put undue pressure.    

    Summarising the findings of the survey,  ESG and CSR group service line leader, public affairs, and corporate reputation Parijat Chakraborty said, “It is the onset of the wedding season in India and we decided to understand views of citizens across socio-economic classification and town classes on their perceptions of weddings. Do we spend too much on weddings, the rationale of opulent weddings, whether big-budget weddings translate into successful marriages, and the best approach to funding weddings? There were so many different views on the topic across demographics and regions. Grandiose weddings are intrinsic to our culture and these are happy occasions for the family to bond, and soak up the completely happy ecosystem when people dress up and celebrate. But all this costs a bomb and it is interesting to see that citizens have broad views about sharing of costs between the bride and the groom and even believe that a happy occasion like a wedding should not be a high-pressure situation.”            

    Methodology

    Ipsos IndiaBus is a monthly pan India omnibus (which also runs multiple client surveys), that uses a structured questionnaire and is conducted by Ipsos India on diverse topics among 2200 respondents from SEC A, B and C households, covering adults of both genders from all four zones in the country. The survey is conducted in metros, Tier one, Tier two and Tier three towns, providing a more robust and representative view of urban Indians. The respondents were polled face-to-face and online. We have a city-level quota for each demographic segment that ensures the waves are identical and no additional sampling error. The data is weighted by demographics and city-class population to arrive at the national average.