
Super Bowl pilot to refine how shared TV audiences are counted

MUMBAI: December proved one thing beyond doubt: nothing pulls audiences together quite like festive favourites and a bit of football. Nielsen’s December 2025 Media Distributor Gauge...


MUMBAI: Nielsen-owned Gracenote has brought in seasoned adtech leader Bill Condon as its first-ever head of advertising sales, signalling a sharper push into the fast-moving world...
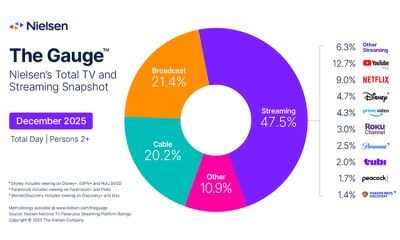

NEW YORK: Streaming tightened its grip on television in December 2025, capturing a record 47.5 per cent of total TV viewing and eclipsing the previous high...

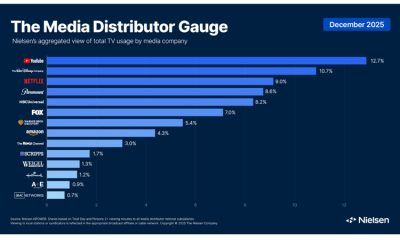
NEW YORK: Paramount and Netflix have delivered knockout performances in November’s streaming battle, each posting double-digit growth that has reshuffled the media distributor rankings and left...


NEW YORK: Nielsen has plugged its prized audience segments into Amazon’s advertising machine, firing up a fresh race for precision targeting across one of the world’s...


MUMBAI: JioStar has appointed Jaideep Singh Juneja as vice president for strategy, insights and marketing, a move that signals the network’s bid to sharpen its game...


MUMBAI: In a landmark moment for the advertising industry, JioStar, in partnership with Nielsen, has unveiled a first-of-its-kind cross-screen measurement studyanalysing how audiences engaged with Tata...


MUMBAI: When it comes to audience measurement, India might finally be ready to stop playing hide and seek. At the 9th edition of Vidnet 2025, Hemant Kewalya,...
MUMBAI: Nielsen is giving TV viewership a fresh scoreboard with the launch of its revamped weekly ranking reports, now supercharged by Big Data plus Panel measurement....

MUMBAI: When it comes to podcasts, location isn’t just about where you hit play, it’s about where the ads land. In a move set to fine-tune...

MUMBAI: When brands can’t measure right, they can’t spend smart. That was the blunt message from Nielsen at the third India Brand Summit 2025, organised by...
MUMBAI: Truecaller has tapped Athul Prabhu as product director for its advertising arm, a move aimed at supercharging the company’s biggest growth engine. Prabhu, an ad-tech...

MUMBAI: Free ad-supported television (Fast) is enjoying a blistering run. The number of Fast channels worldwide has climbed nearly 14 per cent since the start of...
MUMBAI: Raghu Ramanujam, a seasoned product executive with stints at Flipkart, InMobi and Zoho, has joined Nielsen-owned Gracenote as vice president of product management. At Flipkart,...

MUMBAI: Class is in session and Netflix is teaching everyone a lesson in domination. In Nielsen’s 50th The Gauge report for June 2025, streaming flexed its...

MUMBAI: As audiences juggle remotes across streaming, cable, and broadcast, Nielsen and Vizio’s Inscape have hit play on an extended multi-year partnership to keep a sharper...

MUMBAI: Nielsen’s March 2025 report on The Gauge indicates a shift towards more seasonal television viewing patterns in the US. Overall television viewing declined by six...
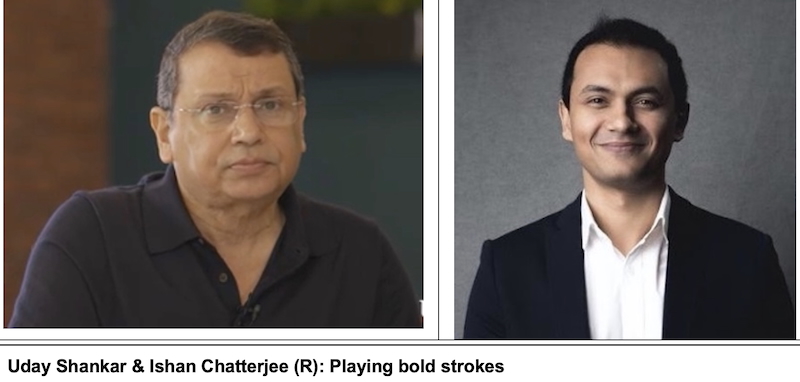
MUMBAI: By partnering with Nielsen, Uday Shankar and Ishan Chatterjee have revolutionised the way advertising revenue is allocated in media. With all relevant consumption metrics now...

MUMBAI: When the ad market is tough and advertisers are demanding transparency, there is no option for publishers but to open up consumption metrics on their...

MUMBAI: Vishal Bali has taken over as Thomson Reuters managing director of Asia & emerging markets, effective January 2025. His appointment was announced in December 2024....
MUMBAI: The fragrance of promotion and greater responsibility on most occasion smells good. As it has in the case of Deepali Jain who has been promoted...

MUMBAI: It was the month of the election and the results thereafter and then you had some great sports on air in the month of November...
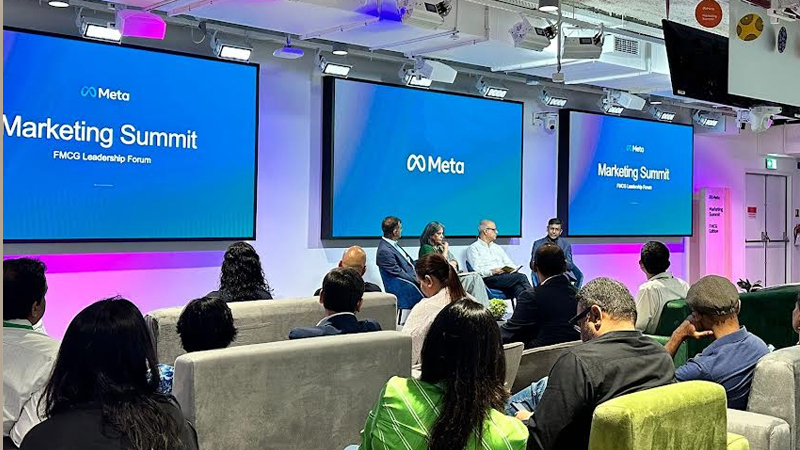
Mumbai: On the sidelines of Meta Marketing Summit – FMCG edition held in Mumbai, the company announced findings from several Meta commissioned studies with leading market...

Mumbai: Aaj Tak has taken top position as news provider for Hindi viewers, achieving an extraordinary milestone during the coverage of the Lok Sabha Election Results...
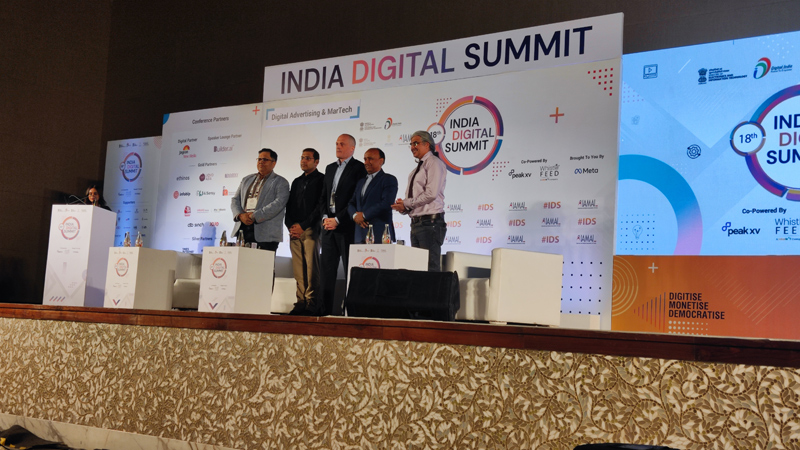
Mumbai: The 18th India Digital Summit, hosted by IAMAI, delved into the intricate world of advertising and the martech industry, amidst the evolving landscape of data...
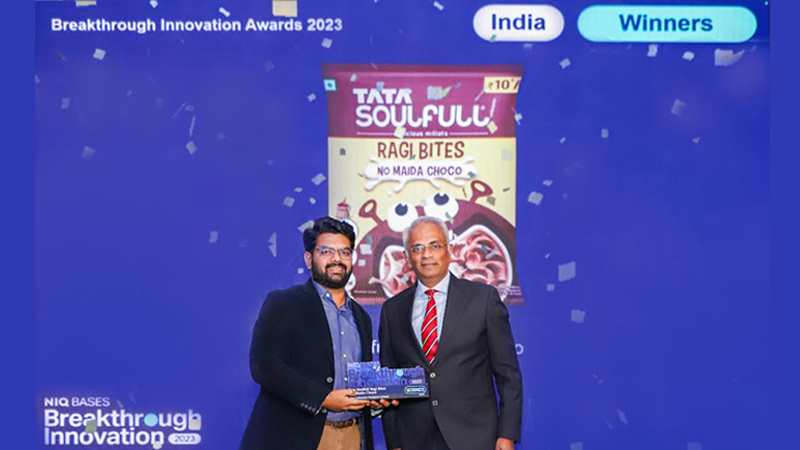
Mumbai: Tata Consumer Soulfull, a pioneer in the Better-for-you Snacks and Breakfast Cereals segment, is thrilled to announce that its Tata Soulfull Ragi Bites No Maida...

Mumbai: The kickoff of the fall TV season in the US and the return of football provided audiences with an abundance of new content in September,...
Mumbai: With the arrival of the holiday season, the Indian Performing Rights Society (IPRS) has launched a campaign titled “#ImagineLifeWithoutMusic.” IPRS said that it is India’s...

Mumbai: In June, streaming captured 33.7 per cent of total television consumption in the US, according to The Gauge, which is Nielsen’s monthly total TV and...

Mumbai: The Indian division of global media agency network, OMD has appointed Charul Tomar as its new head of strategy. She will be spearheading impactful, strategic...

Mumbai: The digital dominance in marketing dollars notwithstanding, with continued digital fragmentation, marketers report data accuracy, measurement, and ROI as paramount concerns. While 69 per cent...
Mumbai: A nearly 20 per cent increase in unique programme titles over the past three years has almost half of the American audiences (46 per cent)...
Mumbai: Google-owned YouTube has announced that popular television shows and films from major studios will be available in the US for free, with ads, using smart...
Mumbai: Nielsen and Experian have announced an expanded strategic initiative to enhance identity data in the United States for digital measurement of the open web. Experian marketing...
Mumbai: Nielsen will expand coverage offered by Nielsen Media Impact (NMI), a national media planning and optimisation solution, to include streaming data from connected television sets (CTV)....
Mumbai: Nielsen and The Trade Desk on Thursday announced a strategic partnership to power identity resolution for open internet measurement in key international markets around the world. ...
Mumbai: It was for the first time since the 1960s, that Nielsen’s measurement lost a “seal of approval” from the industry that uses it, as leading...
Mumbai: Nielsen has announced the launch of Streaming Signals, a new solution for connected TV (CTV) operators and advertisers to better understand who is watching a show...

Mumbai: Nielsen has revealed the first iteration of Nielsen One – its single cross-platform measurement solution. The newest advancement ‘Nielsen One Alpha’ deduplicated ad measurement will...
Mumbai: Nielsen has announced the release of its enhanced identity system for digital ad ratings in 15 markets starting on 1 February 2022. This change enables more...

Mumbai: Nielsen has announced that it will enhance its National television measurement by measuring viewing in a more precise manner, allowing for a future where audience...

Mumbai: It’s never been a better time to be a shopper, given today’s buy-anywhere retail environment. It’s raining deals at stores, on social media, and inside...
Mumbai: The burgeoning of OTT content consumption in the past couple of years fuelled a proportional increase in the demand for third-party viewership data which, in...

New Delhi: Media and entertainment major ViacomCBS on Tuesday announced its partnership with software and data platform, VideoAmp for TV measurement data, possibly leading the way...

Mumbai: Nielsen has announced that it will take the lead on an ‘Impressions-First Initiative’ to support an industry-wide move to impressions-based buying and selling in local...

Mumbai: Nielsen is in the eye of the storm once again following the suspension of accreditation for National and Local TV Ratings service in the US...

Mumbai: Netflix is the uncrowned SVOD king in the United States. This is what the latest report from US-based information, data, and market measurement firm Nielsen...
MUMBAI: Hollywood has always enjoyed a passionate fanbase in India which only grows by leaps and bounds with each passing year. Today, Hollywood movies aren’t just...
NEW DELHI: Dream 11 IPL has started with a bang as the much awaited tournament clocked over 269 million viewers in its opening week, as per...