Tag: Knorr

  • HUL seals the deal: Uprising Science takeover gets CCI nod

    HUL seals the deal: Uprising Science takeover gets CCI nod

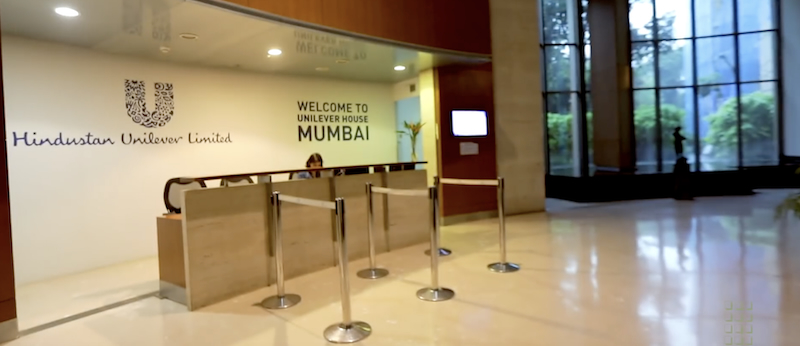
    MUMBAI:  Hindustan Unilever Ltd  (HUL) is set to expand its beauty and personal care empire, acquiring a 90.5 per cent stake in Uprising Science Pvt Ltd , with the remaining 9.5 per cent to follow in two years. The Competition Commission of India (CCI) has given the green light to the transaction under Section 6(2) read with Section 5(a) of the Competition Act, 2002.

    HUL, a behemoth in the FMCG space, boasts a portfolio spanning home care, beauty and personal care, and food and refreshments. Its 50+ brands include household names like Lux, Surf Excel, Lakmé, Knorr, and Kwality Wall’s. With manufacturing facilities across India and a vast distribution network, the company dominates the consumer market.

    Uprising Science, the target in this acquisition, specialises in beauty and personal care, particularly skincare, body care, baby care and hair care products. The acquisition is expected to strengthen HUL’s grip on the premium beauty segment, expanding its product range and market share.

    The companies argued that the deal won’t shake up India’s competitive landscape. However, they acknowledged overlaps in key markets, including skincare and haircare, as well as vertical linkages such as sales through beauty salons. The strategic move aligns with HUL’s broader push into high-growth personal care categories.

    With CCI’s approval in the bag, HUL is set to make further waves in the beauty business. Expect bold moves ahead.

  • Knorr & Netflix set off a dare-to-slurp-ramen-noodles craze ahead of the  Squid Game 2 launch

    Knorr & Netflix set off a dare-to-slurp-ramen-noodles craze ahead of the Squid Game 2 launch

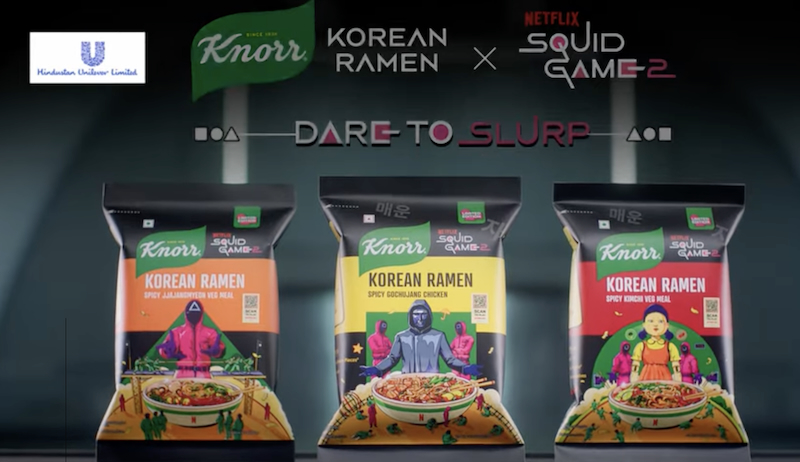
    MUMBAI: Fans of the hit Korean global hit Squid Game and of Korean cuisine have a double delight coming their way. Not only will they get to the watch its second season when it hits Netflix on 26 December they will  also get to slurp up their Korean noodles while watching the show. 

    Food major Knorr – part of Hindustan Unilever- has partnered  with Netflix to launch a special edition Korean ramen range inspired by the show. This includes Squid Game-themed packs in three flavors: Jjajangmyeon, Spicy Kimchi, and Gochujang Chicken. 

    A 90-second film has been launched featuring masked guards and a front man challenging a group of young participants to finish a bowl of spicy Korean ramen in 60 seconds. If they fail, the frontman warns, they will be eliminated.  The participants dig into their bowls and slurp away to their soul’s delight, but they also find it spicy.  The red light-green light doll, Young-hee, makes a cameo and looks around. As the seconds tick down, one of them drops down a trap door as he has been tardy in his eating. The others hurry to finish their bowls. As the stop clock stops, those who don’t finish, drop down trapdoors. 

    And the front man removes his mask to reveal himself to be Gulshan Grover mouthing his famous dialogue: “Front man. Nooo baaaad maaan.”

    Throughout the film, the background music and chants are inspired from the Squid Games series, making for an eerie and thrilling film. It ends with a voice over challenging audiences watching the film to dare to enter the dare to slurp challenge. 
     

    Influencers

    Consumers can do so  by picking up a special Knorr Squid Game pack which features designs from the series and includes a QR code for the Dare-to-Slurp game, offering them a chance to win a trip to Seoul and attend a Squid Game fan event.

    The film – which also has a 40 second version – is being blasted across YouTube, Instagram, Facebook and heard on Spotify. On YouTube, it had generated 10 million views in just nine days.

    An extensive out of home advertising campaign has been planned. 

    As of the night of 19 December, key opinion leaders (read influencers) had been posting videos about them taking part in the challenge.  Knorr’s digital campaign features 45 of them including Orry, Urfi, Falguni Pathak, and Yashraj Mukhate, taking on the Dare to Slurp challenge. Underground rappers Big Deal, Yungsta, Yoki, and Seige are also creating exclusive raps for the campaign. 

  • FY-16: Challenging markets push HUL marketing spends up 16.9 percent

    FY-16: Challenging markets push HUL marketing spends up 16.9 percent

    BENGALURU:  Indian FMCG giant Hindustan Unilever Limited (HUL) spent 16.9 percent more towards Advertisement and Promotions expense (marketing spends, ASP) in the year ended 31 March 2016 (FY-16, current year) as compared to FY-15 on a standalone basis. HUL’s standalone ASP in the current year was Rs 4,526.17 crore (14.1 percent of Total Income from operations or TIO) as compared to Rs 3872.40 crore (12.6 percent of TIO) in the previous year.

    Note: (1) The unit of currency in this report is the Indian rupee – Rs (also conventionally represented by INR). The Indian numbering system or the Vedic numbering system has been used to denote money values. The basic conversion to the international norm would be:
    (a) 100,00,000 = 100 lakh = 10,000,000 = 10 million = 1 crore.
    (b) 10,000 lakh = 100 crore = 1 arab = 1 billion.
    (2) All numbers mentioned in this report are standalone numbers of HUL, unless stated otherwise.

    HUL chairman Harish Manwani said, “In challenging markets and a deflationary cost environment, we have delivered another year ofcompetitive and profitable growth. The consistency of our performance is a result of managing our business dynamically, and executing ourstrategy with even greater rigour and discipline. Our sustained focus on investing behind brands, sharpeningour executional capabilities anddriving market development has enabled us to keep winning with consumers in a rapidly changing market.”

    Trends:

    This year, HUL’s marketing spends have been the highest in terms of absolute rupees. Over a four year period starting FY-13 until FY-16, HUL’s ASP has been the highest in terms of percentage of TIO at 14.1 percent. Even on a y-o-y basis, its ASP has been higherin terms of absolute rupees as well as on a percentage of TIO basisacross all the four quarters in fiscal 2015-16 as compared to the four quarters of fiscal 2014-15.

    For Q4-16 (quarter ended March 31, 2016, current quarter) ASP was 6 percent more year-over-year (y-o-y) at Rs 1,089.95 crore (13.7 percent of TIO) as compared to Rs 1,027.89 crore but was 4.2 percent lower quarter-over-quarter (q-o-q) as compared to Rs 1,137.79 crore (14.3 percent of TIO).

    During a sixteen quarter period starting Q1-13 until Q4-16, the Indian FMCG major’s ASP in Q1-16 was the highest in absolute rupees at Rs 1,153.39 crore (14.2 percent of TIO), while in terms of percentage of TIO in current fiscal, it was highest in Q2-16 at Rs 1,145.04 crore (14.6 percent of TIO). Please refer to Fig A below. ASP shows linear increasing trend, both interms of absolute rupees as well as in terms of ASP as percentage of TIO during the sixteen quarter period under consideration in this report.

    It is seen from Fig A, that HUL’s ASP is generally the highest in absolute rupees in Q1 of a fiscal, the only exception being FY-14, when Q2-14 and Q3-14 ASP were higher that Q1-14 ASP. However, Q1 ASP has always been higher in absolute rupees than the previous year’s Q4 ASP. Based on this trend, it is likely that HUL’s ASP in Q1-17 will be more than or equal to Rs 1,090 crore

    The company’s TIO in the current year increased 3.8 percent to Rs 31,987.17 crore as compared to Rs 30,805.62 crore in FY-15. TIO in the current quarter increased 3.5 percent y-o-y at Rs 7,945.66 crore from Rs 7,675.63 crore andwas almost flat (declined by 0.4 percent) q-o-q as compared to Rs 7,980.99 crore in Q3-16. Please refer to Fig B below. TIO shows a linear increasing trend during the sixteen quarter period under consideration in this report.

    HUL’s Profit after Tax (PAT) in FY-16 declined 5.4 percent to Rs 4,082.37 crore (12.8 percent margin) as compared to Rs 4,315.26 crore (14 percent margin). PAT in the current quarter increased by 7 percent y-o-y to Rs 1089.59 crore (13.7 percent margin) from Rs 1,018.08 crore (13.3 percent margin) and increased 12.2 percent q-o-q from Rs 971.40 crore in Q3-16. PAT shows a linear decreasing trend in terms of percentage of TIO, but indicates a linear increasing trend in terms of absolute rupees during the sixteen quarter period under consideration in this report.

    HUL’s Q1-16 report about categories

    During the quarter, the Domestic Consumer business grew at 4 percent, with 4 percent underlying volume growth. Growth in the quarter was impactedby the phasing out of Excise Duty incentives, a one-time credit for excise duty refund in the base quarter and marginal price de-growth.

    Soaps and Detergents: Volume growth partially offset by price deflation. Skin Cleansing was driven by strong volume growth on Dove, Lifebuoy and Hamam. In Laundry, growth was led by the premium segment,with Surf maintaining its strong double digit growth momentum. Comfort Fabric Conditioner delivered another strong performance on the
    back of sustained market development. Household Care performance was led by Vim liquids.
    The quarter witnessed price deflation in this segment, albeit at lower levels, arising from actions taken earlier to pass on the benefit of lowercommodity costs to consumers.

    Personal Products: Healthy underlying performance

    The reported growth for this segment was impacted by the phasing out of Excise Duty incentives, a one-time credit for excise duty refund inthe base quarter and the residual impact from the re-alignment of channel spends.

    Skin Care delivered broad based volume growth across Fair & Lovely, Pond’s and Vaseline. The performance of Fair & Lovely was led by BBcream, whilst growth in Pond’s and Lakme was driven by the premium portfolio.

    Hair Care registered another quarter of volume led growth, with Dove and TRESemmé leading the category performance.

    In Oral Care, Close Up continued to do well, while Pepsodent core was relaunched in the quarter.

    Color Cosmetics sustained innovation led double digit growth with Lakme Absolute and 9 to 5 strengthening its position in premium makeup.

    Beverages: Consistent growth

    Tea registered broad based growth, driven by market development and strengthened brand equities across the portfolio. Lipton Green Teamaintained its strong growth momentum. Bru Coffee delivered another quarter of double digit growth.

    Packaged Foods: Double digit growth sustained

    Market development continues to be a key driver of growth for this segment. Kissan delivered another robust quarter on both ketchups andjams, while the solid growth on Knorr was led by Instant Soups. Ice Creams registered double digit growth driven by sharper in-marketexecution on Kwality Walls and the extension of Magnum to new cities.

    Water: Innovation led growth

    Pureit delivered double digit growth led by the strong performance in the ‘Reverse Osmosis’ segment. The portfolio was further strengthenedwith the launch of the ‘PureitUltima with Oxytube’ device in quarter.

    Click here for HUL’s investor release.


  • Rage Communications awarded as the digital marketing mandate for UFS in Australia and New Zealand

    Rage Communications awarded as the digital marketing mandate for UFS in Australia and New Zealand

    MUMBAI: Rage Communications has been awarded the digital marketing mandate for Unilever Food Solutions in Australia and New Zealand. The mandate involves the brands under the UFS umbrella including Knorr, Hellmann’s and Colman’s among others. Rage Communications won the account in a competitive pitch between four agencies. Rage Communications will closely work with UFS’ global partners to strengthen and stabilize its digital footprint in ANZ.

    Speaking on the win, Unilever Food Services digital and trade marketing manager Rishi Sahgal  said, “We were looking for an agency that had the breadth of capabilities to deliver innovative digital solutions across all our brands and help us make a step change in our ability to connect with foodservice operators. Rage Communications demonstrated that they were the right fit for UFS and we are confident they have the capability and passion to be our digital partners moving forward.“

    Commenting on the new win, Rage Communications director Karthik Kumar said, “We are thrilled to be working with Unilever and look forward to delivering great campaigns for the brands under the UFS umbrella. We won this mandate on the back of our strong digital experience and our depth of expertise in developing robust digital solutions for marketing needs.”

    Some of the critical work will include moving the website to a new platform, plan and deliver some specific digital marketing activities that aim at consolidating the digital business gains for UFS in ANZ.

  • Q3-2016: HUL YoY marketing spends up 16.4%

    Q3-2016: HUL YoY marketing spends up 16.4%

    BENGALURU: Indian FMCG giant Hindustan Unilever Limited (HUL) Advertisement and Promotions expense (marketing spends, ASP) in Q3-2016 (quarter ended 31 December, 2015, current quarter, Q3-16) was 16.4 per cent more YoY at Rs 1,137.79 crore (14.3 Total Income from operations or TIO) as compared to Rs 977.12 crore (12.6 per cent of TIO), but declined 0.6 per cent QoQ from Rs 1,145.04 crore (14.4 per cent of TIO).

    Note: (1) 100 lakh = 100,00,000 = 1 crore = 10 million.

    (2) All figures in this report are standalone figures filed by the company. The trends are based on the numbers submitted by the company or picked up from the company’s website.

    Company Speak

    HUL chairman Harish Manwani said, “We have stepped up investment behind our brands and delivered another quarter of profitable volume led growth, consistent with our strategic intent. In an environment of moderating growth and benign input costs, we remain focused on innovation and market development to drive volumes competitively whilst improving operating margins. As channels and markets evolve, we continue to make strategic interventions to strengthen our portfolio and sharpen our executional capabilities to serve our consumers even better.”

    Advertising and Sales Promotion (ASP) trends

    Last quarter (Q2-16), HUL’s ASP was the highest both in terms of absolute rupees and percentage of TIO at Rs 1145.04 crore and 14.4 per cent during a 15 quarter period starting Q1-2013 until Q3-2016. The current quarter’s ASP (mentioned above) is the second highest during the same period. It must be noted than in the current fiscal (FY-2016) during all the three quarters to date, HUL’s ASP has been the highest in rupees and in terms of percentage during the period under consideration and has been above 14 per cent – in Q1-2016, it was 14.2 per cent.

    The lowest ASP in absolute rupees was in Q2-2013 at Rs 768.98 crore (12.2 per cent), while it was lowest in terms of percentage of TIO in Q4-14 at 11.8 per cent (Rs 840.34 crore). The white broken trend line indicates that ASP in absolute rupees during the period under consideration shows an upward trend. ASP in terms percentage of TIO (broken pink line) also shows an upward trend, though not as sharp as in the case of absolute rupees during the period under consideration. As a matter of fact, since Q1-2013, the company’s ASP has been the highest in absolute rupees in the first quarter (Q1) and the lowest in the second quarter (Q2), the only exception being in the year 2014, where Q2-2014 ASP was the highest in the year and was more than Q1-2014 ASP, which was second highest in that year. In FY-2013 and FY-2014, ASP was lowest in Q4, while in Q4-2015, ASP was more than in Q3-2015.

    HUL Revenue and PAT

    Please refer to Fig B above. HUL reported 2.7 per cent YoY growth in TIO in Q3-2016 at Rs 7,980.99 crore as compared to Rs 7,774.32 crore and was 0.3 per cent higher QoQ as compared to Rs 7,955.39 crore. The company’s TIO shows a linear increasing trend as indicated by the broken blue trend line in Fig B. TIO in Q1-2016 is the highest reported by the company during the 15 quarter period under consideration in this report.

    HUL’s PAT in Q3-2016 was 22.4 per cent lower YoY at Rs 971.40 crore (12.2 per cent margin) as compared to Rs 1,252.17 crore (16.1 per cent margin) and was one per cent more QoQ as compared to Rs 962.24 crore (12.1 per cent margin). During the period under consideration, HUL’s highest PAT was highest in Q1-2013 at Rs 1,331.19 crore (20.9 per cent of TIO), both in terms of absolute rupees and in percentage of TIO. While PAT in absolute rupees shows a linear increasing trend as indicated by the broken pink trend line in Fig B, while in terms of percentage of TIO, the linear trend is declining as indicated by the broken yellow line.

    HUL’s take on categories and its brands

    Soaps and Detergents

    Robust volume growth offset by price deflation was seen. The segment witnessed continued price deflation in the quarter given the benign input costs. Skin Cleansing was driven by strong volume growth on Dove, Pears and Lifebuoy. The liquids portfolio registered another quarter of double digit growth. In Laundry, growth momentum was sustained with both Surf and Rin growing volumes in double digit while Comfort Fabric Conditioners led market development of the category and delivered another quarter of high growth. Household Care performance was driven by Vim.

    Personal Products

    The reported growth of this segment was impacted by the delayed winter and the one-time realignment of channel spends undertaken with a view to driving its effectiveness in the marketplace Skin Care delivered volume led growth driven by Fair and Lovely, Pond’s and Lakme. Fair and Lovely continued to do well and saw an encouraging response to the BB cream. The performance of Pond’s was led by premium skin lightening while Lakme growth was buoyed by premium innovations and facewash. Hair Care maintained its strong volume led growth momentum, with Dove and TRESemmé leading the category performance. In Oral Care, the overall performance was subdued. Close Up growth was driven by impactful activation while Pepsodent Clove and Salt continued to do well. Lakme Colour Cosmetics sustained its strong innovation led growth across the core, Absolute and 9 to 5 ranges.

    Beverages

    In Tea, Red Label, Taj Mahal and 3 Roses grew well, driven by focused in-market initiatives. Lipton Green Tea registered another quarter of high growth on sustained market development. In Coffee, Bru delivered double digit growth and achieved market leadership.

    Packaged Foods

    The segment saw its ninth successive quarter of double digit growth. Sustained market development and recent innovations resulted in another quarter of double digit growth across all key brands. Kissan maintained its strong growth momentum across both Ketchups and Jams. Knorr growth was led by new variants of Instant Soups and a new range of Knorr Chef’s Masalas was introduced at the quarter end. Ice Creams delivered another strong quarter, led by Magnum and sharper in-market execution on Kwality Walls.