Tag: Financial

  • Q3-2015: Godrej Consumer Products marketing spends down 4.2 per cent; all categories grow

    Q3-2015: Godrej Consumer Products marketing spends down 4.2 per cent; all categories grow

    BENGALURU: Following a strong turnaround in the last quarter, Godrej Consumer Products Limited (GCPL) reported 12.8 per cent y-o-y growth in consolidated Income from Operations (TIO) to Rs 2235.71 crore from Rs 1982.27 crore and an 8.5 per cent q-o-q growth from Rs 2060.12 crore. For the nine month period ended 31 December, 2014 (9M-2015), the company’s TIO increased 9.1 per cent to Rs 6184.34 crore from Rs 5670.89 crore in 9M-2014.

    Note: 100,00,000 = 100 lakh = 10 million = 1 crore

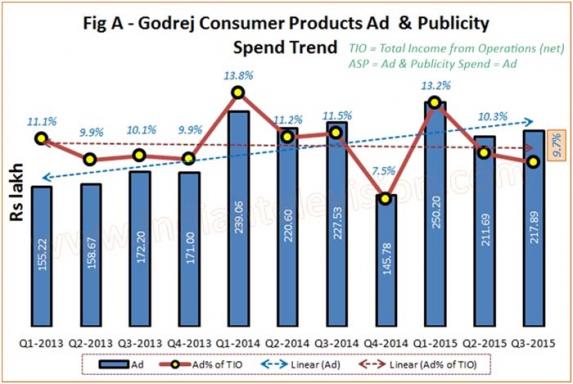
    GCPL‘s advertising and publicity spends (ad) in the current quarter reduced 4.2 per cent to Rs 217.87 crore (9.7 per cent of TIO) from Rs 227.53 crore (11.5 per cent of TIO) in the corresponding year ago quarter, but increased 3 per cent from the Rs 211.69 crore (10.3 per cent of TIO) in the preceding quarter. In 9M-2015, the company’s ad spend was 1.1 per cent lower at Rs 6709.78 crore (11 per cent of TIO) than the Rs 687.19 crore (12.1 per cent of TIO) in 9M-2014.

    During the 11 quarter period starting Q1-2013 until Q3-2015, GCPL’s simple average ad spends was 10.8 per cent of TIO. Consequently, the current quarter’s ad spends were 1.1 per cent lower than average. GCPL’s ad spend shows an increasing linear trend in terms of absolute rupees, but a liner dip in terms of percentage  of TIO during the period under consideration. GCPL’s highest ad spends in terms of absolute rupees and percentage of TIO was in Q1-2014 at Rs 239.06 and 13.8 per cent of TIO respectively. The company’s lowest ad spend in terms of absolute rupees and percentage of TIO was in Q4-2014 at Rs 145.78 crore and 7.5 per cent of TIO.

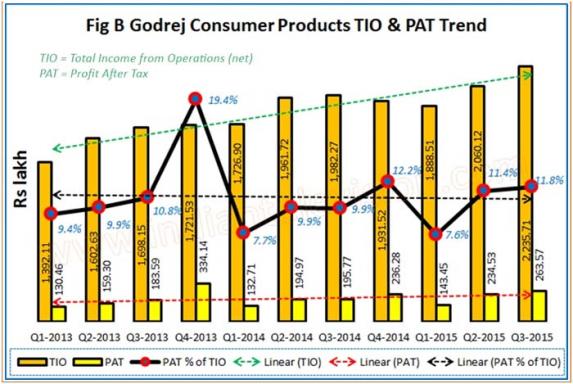
    GCPL’s TIO in the current quarter was the highest. TIO shows an increasing linear trend during the period under consideration.

    The company’s profit after tax (PAT) in the current quarter increased 20.3 per cent to Rs 263.7 crore (11.8 per cent of TIO) from RS 195.77 crore (9.9 per cent of TIO) and was 12.4 per cent more than the Rs 243.53 crore (11.4 per cent of TIO) in Q2-2015. For 9M-2015, PAT at Rs 641.55 crore (10.4 per cent of TIO) was 22.6 per cent more than the Rs 523.44 crore (9.2 per cent of TIO) in 9M-2014.

    GCPL’s PAT was highest, both in terms of absolute rupees and percentage of TIO at Rs 334.14 crore and 19.4 per cent of TIO in Q4-2013. While PAT shows an increasing linear trend in absolute rupees during the 11 quarters under consideration, in terms of percentage of TIO, the linear trend is downward.

    GCPL says in its earnings release that all categories have grown.

    Household Insecticides

    Household insecticides growth momentum has returned to normal levels and GCPL says that it clocked a growth of 16 per cent, well ahead of category growth. The company’s focus on improving market share continues and GCPL exited December 2014 with highest ever market share in this category. It launched a Neem Low Smoke Coil variant, to premiumise its coil franchise and aid market share gains. Good knight Fast card continues to see strong demand and the company plans to leverage its distribution strength for next level of growth.

    Soaps

    In Soaps, the company says that it continued double-digit growth momentum and outperformed the category (where growth recovered to low single digits) with a value growth of 11 per cent. GCPL says that it recorded strong growth across its key brands. This was aided by focused marketing campaigns, consumer offers and localised activation programmes. Gross margins during the quarter benefited from lower palm oil prices and have improved significantly.

    Hair Colours

    GCPL sustained strong growth momentum in Hair Colours and clocked a volume led sales growth of 10 per cent, despite a significantly higher base from last year. It says that it outperformed the category and gained further market share. Godrej Expert Rich Cr?me continues to gain market share, backed by a strong build-up in distribution and large-scale activation programmes.

    Air Fresheners

    Air Freshener brand, Godrej aer, continues to do well, aided by GCPL’s innovative gel format technology and consumer engagement initiatives. In little over two years of launch, it now features among the top 3 players in the car air care and home spray categories claims GCPL. The company recently launched a unique vehicle PUC renewal campaign to create awareness about air pollution.

    Health and Wellness

    GCPL’s recently launched Health and Wellness portfolio of hand washes, a hand sanitiser and anti-mosquito spray, under Godrej Protekt, is being well received in modern trade says the company.

    Liquid Detergents

    GCPL claims that Liquid Detergents sales have increased by 13 percent, despite the late onset of the winter and that Ezee continues to do well aided by the Ezee ‘Rahaat Ek Abhiyaan’ campaign.

    Company Speak

    Commenting on the financial performance of Q2-2015, Godrej group chairman Adi Godrej said, “After a few quarters of sluggish growth, consumer demand in India started to show early signs of a recovery in the third quarter of FY 2015. Our business has delivered strong, competitive double-digit growth across categories. We have also further strengthened our leadership positions across our core categories.

    Consolidated organic constant currency sales increased by 16 per cent, ahead of the market. Organic constant currency operating earnings growth was even stronger at 28 per cent, led by prudent cost management, benign raw material costs and our efforts to effectively leverage our brand platforms.

    In organic constant currency terms, our international business registered a robust top-line growth of 20 per cent and an operating earnings growth of 43 per cent.

    After a challenging few quarters, the growth prospects of the Indian economy are looking more favourable. We expect the economy to pick up pace in FY 2016. We are beginning to see improved consumer sentiment on the ground and are hopeful that this will translate into better consumer demand in the quarters ahead. With our relentless focus on innovation, we are in a good position to capitalise on the uptick in demand and growth. We will continue to focus on sustaining and extending leadership in our core categories. We are becoming operationally more efficient, while investing for the longer term.

    We expect growth in the second half of this fiscal year should be better than the first half. Consequently, our intent is to deliver a stronger performance overall this year, compared to the previous year.

    The medium and long-term growth prospects in India and our other emerging markets remain robust. I am confident that with our clear strategic focus, differentiated product portfolio, superior execution and top-notch team, we will continue to deliver industry-leading results in the future.”

    Click here to read the unaudited financial statement

  • Q3-2015: Saregama reports lower results; television production segment disappoints

    Q3-2015: Saregama reports lower results; television production segment disappoints

    BENGALURU: Indian custodians of music company Saregama Limited (Saregama) reported an 8.9 per cent drop in Total Income from Operations (TIO) in Q3-2015 to Rs 39.21 crore from Rs 43.02 crore in the corresponding year ago quarter (Q3-2014) and a drop of 4.8 per cent from the Rs 41.20 crore reported in the immediate trailing quarter (Q2-2015). PAT for the current quarter (Q3-2015) was 25.5 per cent more at Rs 1.28 crore (3.3 per cent of TIO) than Rs 1.02 crore (2.4 per cent of TIO) in Q2-2014 and fell by 38.5 per cent from the Rs 2.08 crore (5 per cent of TIO) in Q3-2014.


    Note: 100,00,000 = 100 lakh =10 million = 1 crore.


    In the nine month period ended 31 December, 2014 (9M-2015), Saregama’a TIO fell 1.3 per cent to Rs 122.72 crore from Rs 124.36 crore reported for 9M-2014. PAT for 9M-2015 at Rs 6.73 crore (5.5 per cent of TIO) increased 26 per cent from Rs 5.34 crore (4.3 per cent of TIO) in 9M-2014.


     Revenue Streams


    The company’s net sales income in Q3-2014 at Rs 14.05 crore (35.8 per cent of TIO) was 8.3 per cent less than the Q2-2015 sales income of Rs 15.33 crore (37.2 per cent of TIO) and was 22.9 per cent lower than the Rs 18.22 crore (42.4 per cent of TIO) in Q3-2014. For 9M-2015, net sales income fell 6.2 per cent to Rs 44.45 crore (36.2 per cent of TIO) from Rs 47.41 crore (38.1 per cent of TIO) in 9M-2014.


    License Fee income in Q3-2015 at Rs 26.1 crore (66.7 per cent of TIO) was 1.3 per cent more than the Q2-2015 license fee income of Rs 25.80 crore (62.6 per cent of TIO) and was 6 per cent higher than the Rs 24.67 crore (57.3 per cent of TIO) in Q3-2014. License Fee Income rose 1.8 per cent to Rs 78.06 crore (63.6 per cent of TIO) in 9M-2015 from Rs 76.71 crore (61.7 per cent of TIO) in 9M-2014.


    Segment Results:


    Two segments’ contribute to Saregama’s revenue – Music and Films and Television serials (TV).


    Music


    Saregama’s Music segment reported 2.5 per cent rise of operating revenue to Rs 26.60 (67.8 per cent of TIO) in Q3-2015 from Rs 25.96 crore (63 per cent of TIO) in Q2-2015 and increased 1.8 per cent from Rs 26.13 crore (60.7 per cent of TIO) in Q3-2014. For 9M-2015, operating revenue fell 1.5 per cent to Rs 79.44 crore (64.7 per cent of TIO) from Rs 80.68 crore (64.9 per cent of TIO) in 9M-2014.


    The segment reported 50.1 per cent increase in operating profit to Rs 9.92 crore in the current quarter from Rs 6.61 crore in the preceding quarter and was 15.8 per cent more than the Rs 8.57 crore in Q3-2014. Operating profit from the music segment increased 9.5 per cent to Rs 28.72 crore from Rs 25.24 crore in 9M-2014.


    Films and Television serials (TV)


    Operating revenue from the TV segment fell 11.4 per cent in Q3-2015 to Rs 13.15 crore from Rs 15.24 crore (37 per cent of TIO) in Q2-2015 and fell 20 per cent from Rs 16.89 crore (39.3 per cent of TIO) in Q3-2014. In 9M-2015, operating revenue from the TV segment fell 0.9 per cent to Rs 43.28 crore (35.3 per cent of TIO) from Rs 43.68 crore (35.1 per cent of TIO) in 9M-2014.


    This segment reported a loss of Rs 0.23 crore in Q3-2015 as compared to the operating profit in Q2-2015 of Rs 0.19 crore and an operating profit of Rs 0.69 crore in Q3-2014. In 9M-2015, TV segment reported operating loss of Rs 0.86 crore against an operating profit of Rs 3.60 crore in 9M-2014.


    Let us look at the other numbers reported by Saregama for Q2-2015.


    Saregama’s Total Expenditure (TE) in Q3-2015 at Rs 37.57 crore (95.8 per cent of TIO) was 6.8 per cent less than the Rs 40.33 crore (97.9 per cent of TIO) in Q2-2015 and was 9.9 per cent lower than the Rs 41.7 crore (96.9 per cent of TIO) in Q3-2014. For 9M-2015, TE fell 1.9 per cent to Rs 117.06 crore (95.4 per cent of TIO) from Rs 119.37 crore in 9M-2014.


    Saregama paid 32.3 per cent lower Royalty Fees at Rs 3.10 crore (7.9 per cent of TIO) in Q3-2015 as compared to the Rs 4.58 crore (11.1 per cent of TIO) in Q2-2015, but was 11.2 per cent less as compared to the Rs 3.49 crore (8.1 per cent of TIO) in Q3-2014. 9M-2015 Royalty Fees paid by the company fell 14.6 per cent to Rs 13.2 crore (10.6 per cent of TIO) from Rs 15.24 crore (12.3 per cent of TIO) in 9M-2014.


     Saregama’s cost of production of films, television and portal (Production cost) in Q3-2015 at Rs 13.60 crore (34.7 per cent of TIO) was 5.8 per cent lower than the Rs 14.44 crore (35 per cent of TIO) in Q2-2015 and was 4.4 per cent less than the Rs 14.23 crore (33.1 per cent of TIO) in Q3-2014. 9M-2015 production cost at Rs 41.79 crore (34.1 per cent of TIO) was 12.9 per cent more than the Rs 37.03 crore (29.8 per cent of TIO) in 9M-2014.

  • Q2-2015: Prime Focus revenue up 43.3 percent, loss widens by Rs 36 crore

    Q2-2015: Prime Focus revenue up 43.3 percent, loss widens by Rs 36 crore

    BENGALURU: Prime Focus Limited (PFL) reported 48.3 per cent growth in Income from Operations (TIO) in the quarter ended 31 December, 2015 (Q2-2015, current quarter) to Rs 316.67 crore from Rs 222.33 crore in the corresponding year ago quarter (quarter ended 31 December 2013, or Q3-2014) but was 10.7 per cent lower than the Rs 356.96 crore in the immediate trailing quarter Q1-2015 (q-o-q).


    Notes:


    (1) 100,00,000 = 100 lakh = 10 million =1 crore


    (2) The company had filed results for a fifteen month period ended 30 June 2014, hence y-o-y comparison is being done between Q2-2015 and Q3-2014 and q-o-q comparison is between Q2-2015 and  Q1-2015 (quarter ended 30 September 2014).


    The company’s loss widened by Rs 36.17 crore in Q2-2015 as compared to the profit after tax (PAT) of Rs 10.33 crore (4.6 per cent of TIO) and a loss of Rs 22.01 crore in the immediate trailing quarter.The company says that loss for the quarter widened primarily due to non-cash tax charges, adverse FX fluctuation, residual exceptional integration expenses and finance charges.


    PFL, in its earnings release for the previous quarter (Q1-2015), had said that loss for Q1-2015 had risen to Rs 22.02 crore because margins had been impacted primarily due to seasonal effects and due to significant duplication of costs in the creative services business in the first quarter post-merger. The company had initiated a global Integration process at its London, Vancouver and Indian facilities across both these entities. Consequently, the effects of the first phase of one time integration costs were also reflected in the financials claimed PFL. In its current quarter earnings release, PFL says Global integration of DNeg and PFW was proceeding as expected, with major integration expenses already incurred.


    PFL’s simple EBIDTA excluding other income and based on the numbers submitted by it to the stock exchanges at Rs 35.48 crore was 20.9 per cent less than the EBIDTA of Rs 48.88 crore in the year ago quarter, but was a whopping 67.4 per cent more than the Rs 21.19 crore in the immediate trailing quarter.


    Click here to read the full report

  • Q3-2015: HT Media Radio segment reports 42.2% higher operating result

    Q3-2015: HT Media Radio segment reports 42.2% higher operating result

    BENGALURU: HT Media Limited’s (HT Media) radio segment reported a 42.2 per cent q-o-q growth in operating result for Q3-2015 at Rs 9.44 crore versus the Q2-2015 operating profit of Rs 6.64 crore and was 21.2 per cent more than the Rs 7.79 crore in the corresponding quarter of 2014. The segment’s 9M-2015 operating result at Rs 20.65 crore was 27.9 per cent more than the Rs 16.15 crore in 9M-2014.


    Note: (1) 100,00,000 = 100 Lakhs = 10 million = 1 crore

    (2) The figures mentioned in this report are consolidated figures unless stated otherwise.


    HT Media’s radio segment reported revenue of Rs 25.81 crore, six per cent more than the Rs 24.35 crore in Q2-2014 but 3.2 per cent lower than the Rs 26.67 crore in Q3-2014. The company operates four radio stations in the country under the brand Fever 104 FM.


    Let us look at the other Q3-2015 and 9M-2015 figures reported by HT Media:


    HT Media reported eight per cent higher total income from operations (TIO) at Rs 605.50 crore as compared to the Rs 560.88 crore in Q2-2015 and 4.2 per cent more than the Rs 533.53 crore in Q3-2014. For 9M-2015, HT Media reported TIO of Rs 1712.79 crore, which was 3.4 per cent more than the Rs 1656.86 crore in 9M-2014.


    The company’s PAT for Q3-2015 at Rs 63.97 crore (10.6 per cent of TIO) was 45.8 per cent more than the Q2-2015 PAT of Rs 43.89 crore (7.8 per cent of TIO) but 4.6 per cent lower than the Rs 67.02 crore (11.5 per cent of TIO) in Q3-2014. For 9M-2015, HT Media reported PAT of Rs 140.53 crore (8.2 per cent of TIO), which was 18.6 per cent lower than the Rs 172.69 crore (10.4 per cent of TIO) in 9M-2014.


    Three segments contribute to HT Media’s revenue – (1) Printing and publishing of newspapers and periodicals (Publishing), (2) Radio and (3) Digital.


    HT Media’s publishing segment reported revenue of Rs 553.2 crore (91.4 per cent of TIO) for the current quarter, which was eight per cent more than the Rs 510.75 crore (91.1 per cent of TIO) in Q2-2015, and 3.7 per cent more than the Rs 533.53 crore (91.8 per cent of TIO) in Q3-2014. In 9M-2015, the publishing segment reported revenue of Rs 1565.49 crore (91.4 per cent of TIO), which was 2.1 per cent more than the Rs 1533.96 crore (92.6 per cent of TIO) in 9M-2014.


    HT Media’s publishing segment reported an increase in operating profit of 17.1 per cent to Rs 78.49 crore in Q3-2015 as compared to the Rs 67.04 in Q2-2015, but was 8.7 per cent lower than the Rs 85.93 crore in the corresponding year ago quarter. The segment reported a 7.4 per cent fall in operating profit to Rs 210.08 crore in 9M-2015 versus Rs 226.97 crore in 9M-2014.


    The company’s digital segment reported 6.9 per cent higher revenue at Rs 26.65 crore in Q3-2015 as compared to the Rs 24.93 crore in Q2-2015 and 36.4 per cent more than the Rs 19.54 crore in Q3-2014. For 9M-2015, HT Media’s digital segment reported a 38.4 per cent growth in revenue to Rs 74.13 crore versus the Rs 54.40 crore in 9M-2014. This segment has been regularly reporting operating loss (loss). Its loss in Q3-2015 was Rs 14.42 crore; Q2-2015 was Rs 14.7 crore; for Q3-2014 loss was Rs 7.6 crore. For 9M-2015, HT Media’s digital segment reported loss of Rs 41.31 crore versus Rs 34.73 crore in 9M-2014.


    The company, in its investor presentation, says that advertising revenue in the current quarter grew 12 per cent to Rs 496.7 crore from Rs 444.4 crore in the immediate trailing quarter and grew four per cent as compared to the Rs 478.3 crore in the corresponding year ago quarter.


    Circulation revenues in Q3-2015 at Rs 73.4 crore grew two per cent q-o-q from Rs 71.7 crore in Q2-2015 and grew 10 per cent from Rs 66.5 crore in Q3-2014.


    Other revenue increased one per cent in Q3-2015 to Rs 79.8 crore from Rs 78.7 crore in Q2-2015 and was 10 per cent more than the Rs 72.3 crore in Q3-2014 further informs HT Media.


    HT Media chairperson and editorial director Shobhana Bhartia said, “We are happy to report revenue growth across all our core businesses on the back of higher advertising in the festive season. We increased our circulation in the Hindi belt, strengthening our position in Uttar Pradesh and Bihar; Mumbai is growing steadily; and we remain the most read English daily in Delhi and the national capital region. Our digital businesses continue to show traction and radio remains highly profitable.”


    “Raw material costs show a downward trend and we will benefit from the same in coming quarters. The announcement of Phase III expansion in FM Radio is a positive development and we believe we will be able to add to our portfolio of stations. We expect to close the year on a strong note and carry the momentum into the next year. The company is well positioned to seize any opportunity that comes its way,” she added.

  • Q3-2015: DQ Entertainment reports lower numbers

    Q3-2015: DQ Entertainment reports lower numbers

    BENGALURU: The Tapas Chakravarti led DQ Entertainment (International) Limited (DQEIL) reported a profit after tax (PAT) of Rs 2.24 crore (9.3 per cent of Total Income from Operations or TIO) in Q3-12015 (quarter ended 30 December, 2014, current quarter) versus a loss of Rs 12.39 crore in Q3-2014. PAT for the current quarter, however was down to less than a third (down by 70.5 per cent) as compared to the Rs 14.43 crore (2.47 per cent of TIO). PAT in 9M-2015 at Rs 6.61 crore (5.6 per cent of TIO) was less than a one fourth (down 76.5 per cent) the Rs 28.11 crore (20.4 per cent of TIO) in HY-2014.


    Note: 100,00,000 = 100 Lakhs = 10 million = 1 crore


    Two segments contribute to DQEIL revenues – animation and distribution. The company’s animation segment, reported an operating profit of Rs 19.93 crore on segment revenue of Rs 22.61 crore in Q3-2015. For Q3-2014, animation segment had reported operating profit of Rs 20.56 crore on higher operating revenue of Rs 37.88 crore, while in Q2-2015, the segment reported revenue of Rs 39.94 and an operating profit of Rs 23.62 crore. For 9M-2015, this segment reported revenue of Rs 72.47 crore and an operating profit of Rs 46.51 crore versus higher revenue of Rs 107.03 crore and higher operating profit of Rs 59.34 crore in 9M-2014.


    The company’s distribution segment reported the following numbers: Q3-2015 – Revenue Rs 23.1 crore, operating profit Rs 15.37 crore; Q3-2014 – Revenue Rs 12.97 crore, operating profit Rs 6.49 crire; Q2-2015 – Revenue Rs 12.71 crore, operating profit Rs 12.02 crore; 9M-2015 – Revenue Rs 46.51 crore, operating profit Rs 26.2 crore; 9M-2014 – Revenue Rs 30.83 crore, operating profit Rs 14.01 crore.


    For the detailed report, click here:

  • Q3-2015: Den Network reports 18 per cent y-o-y growth in cable subscription revenue

    Q3-2015: Den Network reports 18 per cent y-o-y growth in cable subscription revenue

    BENGALURU: Den Networks Ltd’s (Den Networks) cable business subscription revenues net off LCO share grew 18 per cent, up 11 per cent y-o-y to Rs 116 crore in the current quarter from Rs 97 crore in Q3-2014 and its cable business operation margin was maintained at 19 per cent q-o-q.


    Den added 1,97,000 set top boxes (STB) in Q3-2015, taking the total STBs deployed to approximately 68 lakh. The company said that its current digital subscriber base in phase 1 and 2 is approximately 50 lakh. Digital subscribers are expected to increase significantly with acceleration in non-DAS market informs the company. 


    Note: 100,00,000 = 100 lakh = 10 million = 1 crore


    Den Networks TIO at Rs 269.82 crore in Q3-2015 fell two per cent from Rs 274.26 in Q3-2014 and fell 7.9 per cent from Rs 291.72 crore in the preceding quarter. However, TIO in 9M-2015 at Rs 859.34 crore was 5.5 per cent more than the Rs 814.83 crore in HY-2014.


    Den Networks recently launched its high speed broadband service, which is gaining great traction having achieved an average ARPU of Rs 740 per month in Q2-2015. This quarter, Den says that ARPU has improved to Rs 748 per month.


    The company also says that its joint venture (JV) with Snapdeal.com has been received extremely well. Within the first month, Den Network claimed in Q2-2015 that the company has clocked an annualised Gross Merchandise Value (GMV) in excess of Rs 50 crore based on the annualised latest daily run rate and was expected to scale significantly as the channel gets distributed across networks. For Q3-2015, the company says that the market place based model now reaches 1.9 crore homes clocking Gross Merchandise Value (GMV) of Rs 100 crore.


    Let us look at the other numbers reported by Den Networks:


    Total expense (TE) in Q3-2015 at Rs 316.75 crore (117.8 per cent of TIO) was 32.7 per cent more than the Rs 238.63 crore (87 per cent of TIO) in Q3-2014 and was 6.4 per cent more than the Rs 297.81 crore (102.1 per cent of TIO) in Q2-2015. In 9M-2015, TE at Rs 899.48 crore (104.7 per cent of TIO) was 29.8 per cent more than the Rs 692.75 crore (85 per cent of TIO) in 9M-2014.


    The company’s content cost in Q3-2015 at Rs 1100.96 crore (40.9 per cent of TIO) was 15.5 per cent more than the Rs 95.33 crore (34.8 per cent of TIO) in Q3-2014 and was 1.1 per cent more than the Rs 108.91 crore (37.3 per cent of TIO) in the immediate trailing quarter. For 9M-2015, content cost at Rs 325.39 crore (37.9 per cent of TIO) was 20.1 per cent more than the Rs 270.88 crore (33.2 per cent of TIO) in 9M-2014.


    Den’s placement fee in Q3-2015 at Rs 8.86 crore was 76.1 per cent more than the Rs 5.03 crore in Q3-2014 and 57.4 per cent more than the Rs 5.63 crore in Q2-2015. 9M-2015 placement fee at Rs 19.81 crore was 19.1 per cent more than the Rs 16.64 crore in 9M-2014.


    Den’s other expense in Q3-2015 increased 68.6 per cent to Rs 123.32 crore (45.9 per cent of TIO) from Rs 73.15 crore (26.7 per cent of TIO) in the corresponding year ago quarter and was 45.9 per cent more than the Rs 78.61 crore (26.9 per cent of TIO) in the preceding quarter. For 9M-2014, other expense at Rs 272.40 crore (31.7 per cent of TIO) was 27.6 per cent more than the Rs 213.51 crore (26.2 per cent of TIO) in 9M-2014.


    Den’s EBIDTA (without considering other income) in Q3-2015 fell to just Rs 0.28 crore as compared to the EBIDTA of Rs 72.26 crore (26.3 per cent of TIO) in Q3-2014 and the Q2-2015 EBIDTA of Rs 40.94 crore (14 per cent of TIO). EBIDTA for 9M-2015 fell by 2.33 times to Rs 98.38 crore (11.4 per cent of IO) from Rs 228.98 crore in 9M-2014.


    Other Income for the periods under consideration is as follows: Q3-2015 – Rs 23.94 crore; Q2-2015 – Rs 22.47 crore; Q3-2014 – Rs 22.98 crore; 9M-2015 Rs 64.96 crore; 9M-2014 – Rs 34.42 crore.


    The company reported a loss of Rs 62.60 crore in Q3-2015 as against a profit after tax (PAT) of Rs 16.08 crore. The loss in the current quarter was more than thrice the loss of Rs 20.45 crore reported for Q2-2015. The company reported loss of Rs 81.93 crore in 9M-2015 as compared to a PAT of Rs 28.35 crore in 9M-2014.

  • Q3-15: Dabur q-o-q marketing spends up 15.4 per cent

    Q3-15: Dabur q-o-q marketing spends up 15.4 per cent

    BENGALURU: Dabur India Limited (Dabur) spent 15.4 per cent more towards Advertisement and Publicity (ASP) in Q3-2015 at Rs 319.38 crore (15.4 per cent of Total Income from Operations or TIO) as compared to the Rs 253.35 crore (13.1 per cent of TIO) in the immediate trailing quarter and 10.3 per cent more than the Rs 289.62 crore (15.2 percent of TIO) in Q3-2014. This quarter’s ASP is the highest the company has spent over 9 quarters starting Q3-2013 until Q3-2015, both in absolute rupees and in terms of percentage of TIO. In Q1-2015 also, Dabur had spent 15.4 per cent of TIO towards ASP, but the amount was Rs 254.22 crore.

    Note: 100,00,000 = 100 lakh = 10 million = 1 crore

    In 9M-2015, Dabur spent Rs 858.99 crore (14.6 per cent of TIO) towards ASP as compared to the Rs 771.29 crore (14.5 per cent of TIO) in 9M-2014. The company’s lowest ASP in terms of percentage of TIO as well as absolute rupees during the period under consideration was 12.5 per cent and Rs 191.92 crore in Q4-2013. Dabur’s simple average ASP in terms of percentage of TIO is 14.1 per cent during the nine quarter period under consideration.

    Fig 1 below indicates that Dabur’s ASP shows an upward linear trend both in terms of absolute rupees and ASP as percentage of TIO.

    Among the products that Dabur has include health supplements like Chyawanprash, Ratnaprash, Honey, Glucose; digestives like Hamjola – Hajmola Chuzkara and Natkhat Amrud, Pudin hara fizz; OTC and Ethicals such as Lal Tail, Honitus Syrup; Haircare products like Vatika, Vatika Brave and Beautiful digital, Anmol Jasmine marks; Toothpaste brands like Dabur Red, Babool and Meswak; skincare products like Fem natural fairness, Gold Bleach, Gulabari; Homecare brands such as Odomos, Odonil and Sanifresh; Food brands such as Real and Real Active.

    Dabur’s TIO in Q3-2015 was 7.7 per cent higher at Rs 2079.02 crore more than the 1929.58 crore in Q2-2015 and 9.2 per cent higher than the Rs 1904.56 crore in the corresponding year ago quarter. In 9M-2015, TIO at Rs 5887.46 crore was 11 per cent more than the Rs 5305.89 crore in 9M-2014. Figure 2 below indicates that TIO has an increasing linear trend during the 9 quarter period under consideration.

    Dabur PAT in Q3-2015 at Rs 282.78 crore (13.6 per cent of TIO) was 1.6 per cent lower than the Rs 287.48 crore (14.9 per cent of TIO) in Q2-2015 and 16.4 per cent more than the Rs 242.88 crore in Q3-2014. 9M-2015 PAT at Rs 781.07 crore (13.3 per cent of TIO) was 15.1 per cent more than the Rs 678.63 crore in 9M-2014. Fig 2 below indicates that PAT in absolute rupees and in terms of percentage of TIO shows a linear increasing trend.

    “While the macroeconomic environment continues to be challenging and competitive intensity remains high, we continue to pursue a prudent growth strategy and have been efficiently managing the risks and challenges. Despite a sharp fall in growth rates in most consumer products segments, Dabur continued to focus on brand-building and market expansion programmes and reported strong growth in its core categories, which have been significantly ahead of the market. Going forward too, our focus will be on pursuing an aggressive and profitable growth strategy,” said Dabur chief executive officer Sunil Duggal. Going forward, we will continue to pursue an aggressive growth strategy,” Duggal added.

    Category Growths as per the company’s release

    The Toothpaste business for Dabur grew much ahead of the industry ending the quarter with a strong 19 per cent surge. The Home Care business also reported an over 16 per cent growth during the quarter, while the Health

    Supplements business grew by 13.5 per cent. The Hair Care category, led by strong growth in Shampoo business, ended the third quarter of 2014-15 fiscal with a 12.1 percent growth while the Foods category reported a near 12 per cent growth during the quarter.

    The quarter also saw Dabur’s beauty retail subsidiary – NewU – mark a turnaround and report Profits for the first time in a quarter. The growth in Dabur’s International Business was led by Egypt at 29 per cent, Levant (comprising Yemen, Jordan, Lebanon & Syria markets) at 17 per cent and GCC at 14 per cent.

  • Q3-2015: Higher depreciation, finance cost pares SAB profit; EBIDTA up

    Q3-2015: Higher depreciation, finance cost pares SAB profit; EBIDTA up

    BENGALURU: Sri Adhikari Brothers Television Network Limited (SAB TV) reported less than one fifth (down 1/5.7 times) PAT in Q3-2015 at Rs 0.54 crore (2.4 per cent of Total income from Operations or TIO) as compared to the Rs 3.1 crore (16.2 per cent of TIO) in the corresponding year ago quarter, and one fifth of the PAT of Rs 2.73 crore in Q2-2015.


    The company’s depreciation expense in Q3-2015 was 58.9 per cent higher y-o-y at Rs 3.70 crore versus Rs 2.33 crore and 66.8 per cent more than the Rs 22.21 crore in the immediate trailing quarter.


    SAB TV’s interest/finance costs have more than trebled (up 3.28 times) in Q3-2015 at Rs 2.42 crore (10.5 per cent of TIO) versus the Rs 0.8 crore (4.8 per cent of TIO) in the corresponding year ago quarter and more than double (up 2.29 times) the Rs 1.06 crore in the immediate trailing quarter.


    Note: 100,00,000 = 100 lakhs = 10 million = 1 crore


    SAB’s simple EBIDTA without other income calculated using the data furnished by the company to the bourses in Q3-2015 at Rs 6.65 crore (28.8 per cent of TIO) was 9.2 per cent higher y-o-y versus the Rs 6.09 crore (31.8 per cent of TIO) in Q3-2014 and 10.9 per cent more than the Rs 6 crore (27.2 per cent of TIO) in Q2-2015


    Let us look at the other numbers reported by SAB TV for Q1-2015


    SAB reported 20 per cent higher TIO at Rs 23.10 crore in Q4-2015 as compared to the Rs 19;13 crore in Q3-2014 and 5 perceent more than the Rs 22.01 crore in Q2-2015.


    SAB’s total expenditure was up 31.1 per cent at Rs 20.16 crore (87.2 per cent of TIO) in Q3-2015 as compared to the Rs 15.37 crore (80.4 per cent of TIO) in Q3-2014 and was 10.5 per cent more than the Rs 18.24 crore (82.9 per cent of TIO) in Q2-2015.


    The company’s production/direct expense (prodn exp) is a major part of the expenditure. In Q3-2015, SAB TV’s production expense at Rs 14.34 crore (62.1 per cent of TIO), which was 3.7 per cent more than the Rs 11.60 crore (60.6 per cent of TIO) in Q3-2014 and was 1.9 per cent more than the Rs 14.07 crore (63.9 per cent of TIO) in the immediate trailing quarter.


    Click here to read the unaudited results

  • Q3-2015: Hathway reports 2 per cent y-o-y revenue growth

    Q3-2015: Hathway reports 2 per cent y-o-y revenue growth

    BENGALURU: Indian multi system operator (MSO) Hathway Cable and Datacom Limited (Hathway) reported 1.9 per cent y-o-y growth in Q3-2015 with Total Income from Operations (TIO) of Rs 239.14 crore as compared to the Rs 234.78 crore but was 9.2 per cent lower than the Rs 263.51 crore in Q2-2015.


    The company reported a higher loss of Rs 58.05 crore in Q3-2015 than the loss of Rs 36.86 crore in the corresponding year ago quarter and the loss of Rs 39.26 crore reported in Q2-2015.


    Note: 100,00,000 = 100 lakh = 10 million = 1 crore


    Hathway’s EBIDTA calculated based on the figures submitted by the company (without other income) fell to Rs 24.58 crore (10.3 per cent of TIO) in the current quarter as compared to the Rs 36.74 crore (15.7 per cent of TIO) in Q3-2014 and also fell when compared to the Rs 40.03 crore (15.2 per cent of TIO) in the previous quarter.


    Hathway’s income from operations consists mainly of subscription income from cable TV and broadband business, carriage and placement business, advertisement income, activation income from STB and other operating income.


    In Q3-2015, the company’s cable business was 10.8 per cent lower at Rs 99 crore versus the Rs 111 crore in the previous quarter, placement income was down 8 per cent to Rs 75.8 crore from Rs 82.4 crore in Q2-2015, activation business at Rs 7.2 crore was less than a third of the Rs 22.2 crore in the immediate trailing, while broadband income, the only exception, was up 13 per cent at Rs 51.3 crore in the current quarter from Rs 45.4 crore in Q2-2015. The company says that placement revenues were affected due to content related issues in the current quarter that have since been resolved with the broadcasters.


    Let us look at the other figures reported by Hathway:


    Total Expenditure (TE) in Q3-2015 at Rs 274.39 crore (114.7 per cent of TIO) was 17.6 per cent more than the Rs 254.03 crore (108.2 per cent of TIO) in Q3-2014 and was almost same as the Rs 274.27 crore (104.1 per cent of TIO) in Q2-2015.


    A major fraction of TE is the pay channel cost for Hathway. The company’s pay channel cost in Q3-2015 at Rs 94.04 crore (39.3 per cent of TIO) was 12.3 per cent more than the Rs 83.72 crore (35.7 per cent of TIO) in Q3-2014 and was 2.9 per cent lower than the Rs 96.81 crore (36.7 per cent of TIO) in the immediate trailing quarter.


    The company reported 6.9 per cent higher depreciation and amortization expense (depreciation) in Q3-2015 at Rs 59.82 crore (25 per cent of TIO) versus the Rs 55.98 crore (23.9 per cent of TIO) and 17.8 per cent more than the Rs 50.78 crore (19.3 per cent of TIO) in Q2-2015.


    Hathway’s finance cost in Q3-2015 at Rs 26.86 crore (11.2 per cent of TIO) was 19.5 per cent more than the Rs 22.48 crore (9.6 per cent of TIO) and 11.6 per cent lower than the Rs 30.39 crore (11.5 per cent of TIO) in Q2-2015.


    Employee Benefit Expense (EBE) in Q3-2015 was Rs Rs 13.96 crore, in Q3-2014 EBE was Rs 13.79 crore and in Q2-2015 it was Rs 16.03 crore.


    While Hathway’s cable universe subscription numbers and cable paying subscribers remained stagnant at 1.17 crore  and 64 lakh respectively in Q3-2015 as compared to Q2-2015, Hathway has seeded 70000 set top boxes in Q3-2015, taking its digital subscription base to 85 lakh. Further, the company’s broadband home passed and broadband subscribers increased by 5000 and 10000 to 2 lakh and 4.3 lakh respectively, in Q3-2015 as compared to the previous quarter. Hathway also informs that it has about 600,000 STB’s in stock and plans to seed them at a rapid rate.


    Earlier, Hathway had informed BSE that the Board of Directors of the Company at its meeting held on 13 November, 2014, inter alia, has considered and approved the subdivision of face value of Equity Shares into Equity Shares of smaller amount than is fixed in the Memorandum of Association; i.e. to subdivide 1(One) equity share of Rs 10/- each to 5 (Five) equity shares of Rs 2/- each, subject to approval of shareholders.

  • TV Today’s Oye FM up for sale amidst disappointing revenues

    TV Today’s Oye FM up for sale amidst disappointing revenues

    BENGALURU/MUMBAI: Entities in the radio business have started to play their cards for survival in the industry. The first one to make the move was Radio City when it entered in an acquisition agreement with Jagran Prakashan. Now, TV Today’s Oye FM is in spotlight.


    According to an announcement on the BSE, the Board has approved the sale of the radio FM business, which has seven radio stations operating in Delhi, Mumbai, Kolkata, Jodhpur, Amritsar, Patiala and Shimla.


    The corporate announcement stated, “TV Today Network Ltd has informed BSE that the board of directors of the company at its meeting held on 6 February 2015, inter alia, had allotted ESOP as per TVTN Employee stock option plan 2006: Satyaky Chowdhury – 10,500; and Shams Tahir Khan – 7,500.”


    It further said, “The Board has approved the sale of Radio FM Business (Seven Radio Stations) and has further authorised a Committee of Directors / senior officials to negotiate the terms and conditions with potential buyers and to execute the sale, subject to requisite Statutory and Regulatory approvals.”


    No official information has been circulated amongst Oye FM employees giving details of such a sale. But one of the sources said that Oye FM was pretty much evaluating its position in Phase III auctions along with Oye FM’s migration plans. But with the new announcement there is no clarity as to where they stand for Phase III auctions. Currently, the Information and Broadcasting Ministry is working on making the partial auctions happen as smoothly as possible. The first partial auction of FM radio phase III is for 69 existing cities for 135 channels.


    This sale will not be the first for TV Today Network Limited (TVTN). In 2006, TVTN promoter, Living Media, sold the FM radio business under the brand Red FM to a consortium of investors, and later Kalanithi Maran’s Sun Network bought a stake in the company.


    Click here to read the full story