Tag: Charter Communications

  • Charter communications signs deal with Zee for distribution in the US

    Charter communications signs deal with Zee for distribution in the US

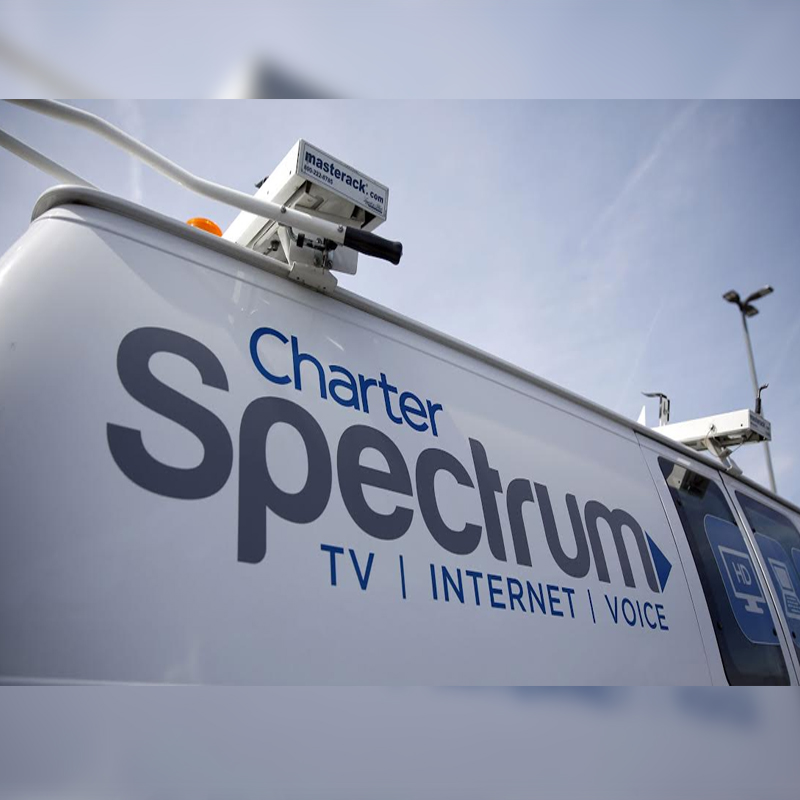
    Mumbai: Charter Communications announced the launch of new South Asian-focused video packages with up to 24 new channels as part of a programming expansion made possible in part by a distribution agreement for all of India’s Zee channels.

    The new India View packages, which feature significantly more content than Charter’s previous South Asian video offerings, are available to spectrum TV subscribers as well as customers who prefer to receive a streaming video package over the Internet+.

    The most popular Indian networks and Zee channels have been added to the India View tiers as part of Charter’s new distribution agreement with Asia TV USA, a Mumbai-based affiliate of Zee Entertainment Enterprises.

    The agreement includes the addition of 22 ZEE channels in multiple languages for spectrum video customers, including &TV, Zee Bangla, Zee Kannada, Zee Keralam, Zee Marathi, Zee Punjabi, Zee Tamil, Zee Telugu, Zee News, Zee World, and WION, in addition to the renewal of the agreement for the flagship Hindi general entertainment channel Zee TV, which is already offered by Charter.

    Charter’s executive vice president of programming acquisition, Tom Montemagno, said,”Our agreement with ZEE gives Spectrum customers access to some of the most popular news, sports, and entertainment programming from India in multiple languages.”

    He further said, “The addition of ZEE’s channels to our lineup enables us to offer our customers South Asian-focused video packages that are meaningfully more robust, with enhanced flexibility and value, and directly aligns with our commitment to provide programming that reflects our customers’ diverse interests and perspectives.”

    To promote the new programming and India View tiers, Charter and Zee have launched a co-branded marketing campaign in Spectrum markets with large South Asian populations, such as Los Angeles, New York, and Dallas, focusing on the streaming packages India View Stream ($19.99/month) and India View Stream Plus ($29.99/month).

    Zee’s agreement with the companies is the latest step in the company’s efforts to serve the growing South Asian communities in the United States. Since 1998, Zee has been present in the United States, promoting culturally rich stories while connecting South Asian audiences to their heartland.

    Zee Entertainment Enterprises content and international markets president Punit Misra said,”The U.S. market is an important part of Zee Entertainment’s international strategy, and the increase in the South Asian population in the U.S. gives us an opportunity to serve the content needs of the growing population segment,”

    He added, “The vast majority of our audiences who live in the U.S. are foreign-born and have immigrated to the U.S. There is a very strong brand affinity in this group towards ZEE. We are delighted to expand our partnership with Charter to make this premium suite of channels available to Spectrum customers.”

    Zee Entertainment Enterprises chief business officer for international business Ashok Namboodiri said, “Our partnership with Charter is extremely vital to our growth objectives in the U.S., and the agreement facilitates the availability of a large variety of entertainment options targeted towards the South Asian audiences for Spectrum customers.”

    He added, “In addition to the Hindi content, we firmly believe that our next set of growth is expected from the vernacular languages like Telugu, Tamil, Kannada, Marathi, Bengali, Malayalam, and Punjabi, and ZEE is evaluating various production opportunities which will bring immense value to this growing population segment in the United States.”

  • Essel Group to acquire further 4.95 per cent in Dish TV Videocond2h from Dhoots

    Essel Group to acquire further 4.95 per cent in Dish TV Videocond2h from Dhoots

    MUMBAI: The Essel group today announced that it has agreed with the Dhoot family that it will acquire an additional 4.95 per cent equity of Dish TV Videocon d2h (DTV d2h) – the company being created out of the merger of Dish TV India Ltd (DTIL) and Videocon d2h Ltd (VD2h).

    The additional transaction will take place a day after the merged entity starts trading on the National stock exchanges at the first day’s closing price. The deal will take placed through Essel group company Veena Investments.

    The purchase will see the Essel group’s equity holding in Dish TV Videocon d2h (DTVd2h) go up to 40.95 per cent. The media group’s share of DTVd2h will further rise as it has agreed with the Dhoot family to acquire an additional 4.95 per cent equity shares from it a year after the merged entity starts trading on the NSE. Both will have a window of three months to complete the transaction then.

    The Dhoot family’s equity stake in DTVd2h will fall to 23.05 following the first sale and to 18.1 per cent following the second, while the Essel group’s holding will rise to 45.9 per cent at the end of the second transaction. This clearly indicates who will be in the drivers seat at DTVd2h – Jawahar Goel, the brother of media baron Subhash Chandra.

    The two family groups had earlier this month announced the merger of their two firms which would result in the creation of a pay TV provider with a subscriber base of 27.6 million, making it the second largest in the world just after the US pay TV giant DirecTV and ahead of John Malone’s Charter Communications.

    Pre-merger, the Essel group owns 64.44 per cent equity in DTIL, the Dhoot family owns 51.17 per cent in Vd2h. 35.95 per cent of the latter’s holding is in the hands of overseas depository holders on Nasdaq on which it is listed. The firm is to be delisted from the US exchange and the depositary receipt holders will have the option to directly get shares of DTVd2h or its GDRs as the latter is expected to be listed on the Luxemborg stock exchange apart from the Bombay stock exchange and the NSE.

  • US Cable TV Industry Report: Video Subscribers again up, Business Services revenue continues to climb

    US Cable TV Industry Report: Video Subscribers again up, Business Services revenue continues to climb

    BENGALURU: For the second consecutive quarter, three of the biggest cable TV entities in the US have reported quarter-over-quarter (q-o-q) growth in video subscribers, along with the regular increase in overall video revenue for the quarter ended 31 March 2016 (Q-16, current quarter). Q1-16 also saw year-over-year (y-o-y) growth in video revenue and subscribers. Despite the increase in video subscribers, the percentage of subscribers opting for video services vis-à-vis customer relationships has declined both y-o-y and q-o-q. Another player – Verizon reported adding 36,000 net video subscribers to its wireline Fios video services in the current quarter. Overall revenue numbers were up, with video revenue increasing along with revenues from other services and streams.

    Comcast Cable Communications segment, Time Warner Cable (TWC) and Charter Communications (Charter) are the three sample players whose numbers have been used in this paper to arrive at generalisations for the US Cable TV industry. All have three major revenue streams – Video, Internet and Voice (VIVE). Besides VIVE, other revenue streams include advertisement and ‘others’. It may be noted that Charter Communications has completed the transactions with Time Warner Cable and Bright House Networks, and soon the name of the products offered by the joined entity will be under the brand Spectrum.

    Business Services Revenue continued to grow in Q1-16. Contribution by Business Services to overall revenue also continued to grow in the current quarter while contributing to the growth of overall Average Revenue Per User (ARPU) for the players as well. Another factor that contributed to overall ARPU increase was the growth in percentage of Triple Play consumers in overall customer relationships. Broadband or High Speed internet segments of the three players reported the highest growth among the three major service streams, with Voice showing the next highest growth. Video grew the least among the three services.

    According to a US Federal Communications Commission (FCC) report, the total number of Cable TV Subscribers in the US in 2012 and 2013 were 56.4 million and 54.4 million respectively. Considering the higher value of 56.4 million, the 3 players in this paper have about two thirds of the cable TV subscribers in the US. According to industry reports, the cable providers industry in the US is highly concentrated, with the top five players generating over 96 percent of revenue.

    Comcast Inc., Cable Communications (Comcast CCS) segment is the largest player by far in the US and among the sample players; Time Warner Cable, Inc., (TWC), about half the size of Comcast’s Cable communications segment in terms of revenue and Charter Communications (Charter) with revenues that are less than half again as much as TWC’s.

    Subscription numbers, revenues

    Please refer to Figures A1 and A2 below.

    In Q1-16, the combined video subscription numbers of the three players increased 0.6 percent y-o-y to 37.574 million (74.4 percent of combined customer relationships) as compared to 37.473 million (77.8 percent of combined customer relationships) and increased 0.2 percent q-o-q from 37.490 million (76.3 percent of combined customer relationships).

    Combined customer relationships in the current quarter increased 5.1 percent y-o-y to 50.488 million as compared to 48.020 million and increased 2.8 percent q-o-q from 49.114 million.

    Combined video revenues in Q1-16 increased 3.2 percent y-o-y to $9,216 million (44 percent of combined total revenue) from $8,929 million (45.6 percent of combined total revenue) and increased 1.8 percent q-o-q from $9,058 million (44 percent of combined total revenue.

    Combined total revenue in Q1-16 increased 6.9 percent y-o-y to $20,925 million from $19.569 million and increased 1.8 percent q-o-q from $20,564 million.

    Note 1:
    (a)Residential customer relationship numbers have been used in this report wherever the breakup has been mentioned in SEC filings by the concerned entity. In the case Comcast Cable Communications segment, the breakup of subscription numbers in terms of Residential and Business Services has not been indicated.
    (b) The results and the conclusions in this report may not necessarily reflect the true trends and nature of the cable communications industry in US.

    Comcast Cable Communications (Comcast CCS)

    Comcast’s CCS segment reported 0.2 percent y-o-y growth in video subscribers at 22.4 million (80.1 percent of customer relationships) in the current as compared to 22.375 million (82.2 percent of customer relationships) in Q1-15 and a 0.1 percent q-o-q growth as compared to 22.347 million (80.7 percent of customer relationships) in Q4-15.

    Customer relationships in the current quarter increased 2.7 percent y-o-y to 27.970 million from27.234 million and increased 1 percent q-o-q from 27.701 million.

    Video revenue increased 3.9 percent y-o-y in the current quarter to $5,538 million (45.4 percent of total or consolidated revenue) from $5,331 million (46.6 percent of total revenue) and increased 2.3 percent q-o-q from $5,416 million (45.2 percent of total revenue).

    Comcast CCS reported consolidated or total revenue of $12,204 million for Q1-16, up 6.8 percent y-o-y as compared to $11,430 million and up 1.9 percent q-o-q as compared to $11,980 million.

    Time Warner Cable (TWC)

    TWC reported 0.2 percent y-o-y growth in video subscribers to 10.842 million (67.2 percent of customer relationships) in Q1-16 as compared to 10.819 million (73.5 percent of total customer relationships) and also 0.2 percent q-o-q growth as compared to 10.821 million (71.5 percent of customer relationships) in the immediate trailing quarter.

    Customer relationships in the current quarter increased 9.6 percent y-o-y to 16.130 million from 14.716 million and increased 6.6 percent q-o-q from 15.129 million.

    Video revenue increased 1.6 percent y-o-y in Q1-16 to $2,508 million (40.5 percent of total or consolidated revenue) from $2,469 million (42.7 percent of total revenue) and increased 1.6 percent q-o-q from $2,471 million (40.7 percent of total revenue).

    TWC reported consolidated revenue or total revenue of $6,191 million, up 7.2 percent y-o-y from $5,777 million and up 2 percent q-o-q from $6,072 million.

    Charter Communications (Charter)

    Charter’s video subscribers increased 4.3 percent y-o-y in Q1-16 to 4.332 million (67.8 percent of customer relationships) from 4.153 million (68.4 percent of customer relationships) and increased 0.2 percent q-o-q from 4.322 million (68.8 percent of customer relationships).

    Customer relationships in the current quarter increased 5.2 percent y-o-y to 6.388 million from 6.070 million and increased 1.7 percent q-o-q from 6.284 million.

    Video revenue increased 3.6 percent y-o-y to $1,170 million (46.2 percent of total or consolidated revenue) from $1,129 million (47.8 percent of total revenue) and increased 0.3 percent from $1,167 million (46.5 percent of total revenue) in Q4-15.

    Consolidated or total revenue in Q1-16 increased 7.1 percent y-o-y to $2,530 million from $2,352 million and increased 0.7 percent q-o-q from $2,512 million.

    Average Revenue per User (ARPU) and multi-play numbers

    ARPU has been increasing as more and more customers move from single to double play and triple play and from double play to triple play. Please refer to Figures B1 and B2 below.

    Note 2:
    ARPU in the case of Charter has been estimated based on the numbers submitted by it for its residential and business services ARPU. Charter’s ARPU numbers in the above chart are likely an approximation.

    Business Services Revenue (BSR)

    All the three players offer video, data (internet) and voice services to businesses. Unlike retail customers, the proportion of data and voice services are higher than video services. Business services revenue has been growing, as has its contribution to overall revenue. BSR’s contribution to total revenue is in double digits, in the case of TWC it was 14.3 percent in Q1-16. In the case of Comcast CCS, BSR contributed $1.3 billion to overall revenue in Q1-16. Please refer to Figures C1 and C2 below.

    Note 3:
    Business services revenue numbers may have many components including revenue from the three main service streams – video, data (high speed internet) and voice as well as revenue from advertising, wholesale transport, others, etc., depending upon the entity.

    Note:
    (a)Residential customer relationship numbers have been used in this report wherever the breakup has been mentioned in SEC filings by the concerned entity. In the case Comcast Cable Communications segment, the breakup of subscription numbers in terms of Residential and Business Services has not been indicated.
    (b) The results and the conclusions in this report may not necessarily reflect the true trends and nature of the cable communications industry in US.

  • Q3-2015: US cable industry video slide continues; ARPU rises

    Q3-2015: US cable industry video slide continues; ARPU rises

    BENGALURU: Like in the previous two quarters and even earlier, the cable industry in the US continues to bleed video subscribers, albeit slower than before, while internet and business services (BS) continue to be growth drivers in terms of subscription numbers and revenue in the quarter ended 30 September, 2015 (current quarter, Q3-2015). This report considers three players for Q3-2015 – Comcast Cable Communications segment, Time Warner Cable and Charter Communications. Overall, YoY and QoQ subscription numbers or customer relationships of the three players in this report have increased, despite a fall in video customers.

    Comcast Inc., Cable Communications segment is the largest player by far among the sample players in this report; Time Warner Cable, Inc., (TWC), is a little less than half the size of Comcast’s Cable communications segment in terms of revenue and Charter Communications (Charter) with revenues that are less than half again as TWC’s.

    Despite the continued slide in video customer relationship, the combined sum of video subscribers in Q2-2015 of the three entities was about 3.72 crore or almost two thirds (61.4 per cent) of the 6.6 crore video subscribers through wire in the US as of 2013 numbers. The three players in this report are generally considered amongst the biggest players in the US cable television industry. All have three major revenue streams – Video, Internet and Voice (VIVE).

    Note: (a) 100,00,000 = 100 lakh = 10 million = 1 crore

    (b) While denominations for US$ have been mentioned in millions or billions where applicable, denominations for numbers have been mentioned lakhs and crores.

    (c) Residential customer relationship numbers have been used in this report wherever the breakup has been mentioned in SEC filings by the concerned entity. In the case Comcast Cable Communications segment, the breakup of subscription numbers in terms of Residential and Business Services has not been indicated.

    (d) The results and the conclusions in this report may not necessarily reflect the true trends and nature of the cable communications industry in US.

    Performance in Q3-2015

    In general, six streams add to most of the three entities’ revenue – three products – Video, high speed Internet, Voice; Business Services (BS); Advertising; and Other. Collectively, the first three have been given the acronym VIVE by the author. Generally VIVE numbers, be they subscription or revenue indicate residential subscribers and revenue from these subscribers in this report. This report examines VIVE and touches briefly upon BS of some of the players later on. It must be noted that BS revenue exceeds revenue from Voice services, but since voice is one of the three limbs of triple play, it has been mentioned along with Video and Internet.

    As mentioned above, in general, Internet has been driving growth, both in terms of revenue and subscription numbers. Contribution by BS is growing and is in low double digits in terms of percentage of overall revenue. Historically, over the previous two years, video revenues in Q3 of a year drop QoQ, before increasing in Q4 again. This has also happened in the current quarter Q3-2015. Due to the drop in video revenues, combined VIVE revenue has dropped QoQ in Q3-2015.

    Overall combined subscription numbers in Q3-2015 increased 0.82 per cent (increased by 397,000) QoQ to 485.52 lakh and increased by 2.78 per cent (increased by 1,315,000) YoY from 472.37 lakh. QoQ growth was driven by a growth in internet and voice subscribers and partly offset by a decline, albeit at a much lower rate, of video subscribers.

    In the current quarter combined Video Subscribers declined 0. 12 per cent QoQ to 371.57 lakh from 372 lakh and declined by 0.54 per cent YoY from 373.60 lakh. Combined high speed data subscribers in the current quarter increased 1.72 per cent QoQ to 403.54 lakh from 396.71 lakh and increased 6.88 per cent YoY from 377.55 lakh. Combined Voice subscribers in Q3-2015 increased 1.48 per cent QoQ to 199.80 lakh from 196.89 lakh and increased 8.30 per cent YoY from 184.48 lakh.

    The combined overall revenue (OR) of the three players in Q3-2015 increased 0.13 per cent (increased by $27 million) QoQ to $20,112 million from $20,085 million and increased 5.62 per cent (increased by $1070 million) YoY from $19,042 million. Please refer to Fig A2 below.

    Combined VIVE revenue in the current quarter declined 0.74 per cent (declined by $120 million) QoQ to $16,075 million from $16,195 million, but increased 4.2 per cent (increased by $648 million) YoY from $15,427 million. Video revenues of all the three players declined in this quarter as compared to the previous quarter. Internet revenues of all the three players increased, while Voice revenue of Comcast Cable Communications Segment and Charter increased. Voice revenue in the case of TWC declined QoQ in Q3-2015.

    Average Revenue Per User (ARPU) continued to rise as is evident from Figure A3 below, with Comcast Cable Communications ARPU at $143.12 in Q3-2015 being about 13 per cent higher than TWC’s ARPU of $126.92 and about 26 per cent more than Charter Communications ARPU of $113.39. This huge discrepancy reflects the fact that Comcast has a much higher proportion of multi-play (triple play and double play) customers when compared to the other two players. Please refer to Figure A4 below. While Comcast Cable Communications segment (A4-1 below) had about 31 per cent of single play customers, and 69 per cent multi-play (33 per cent of double play and 36 per cent triple play) customers in Q3-2015, in the case of the other two players (A4-2 and A4-3 below), single play customers totalled about 39 per cent and multi-play customers around 61 per cent.

    Business Services Revenue

    Combined Business Services Revenue (BSR) of the three entities increased 3.93 per cent QoQ to $2,330 million (11.59 per cent of combined Overall Revenue or combined OR) from $2,242 million (11.16 per cent of combined OR) and increased 17.20 per cent YoY from $1,988 million (10.44 per cent of combined OR). As has been mentioned, contribution by BSR to OR has been increasing – Combined BSR share of combined OR in Q2-14 was 9.99 per cent, in Q3-2015 it was 11.59 per cent.

    Please refer to figure B below. BSR has been increasing in absolute dollars as well as by way of contribution to OR. Amongst the three players in this report, BSR contribution has been the highest in terms of percentage of overall revenues in the case of TWC over the past six consecutive quarters considered in this report. Even in the case of Comcast Cable Communications segment, which had the highest BSR in terms of absolute dollars, BSR’s contribution has entered into double digits in terms of percentage of OR in the current quarter. While Comcast Cable Communications Segment break-up of residential and BSR subscription numbers is not available, Figure B1 below clearly indicates that TWC and Charter BSR subscription numbers have been increasing over time. 

  • Can the Indian cable television industry truly head the US cable television industry way?

    Can the Indian cable television industry truly head the US cable television industry way?

    People often tend to compare the cable television industry in India with that of the US. They say that the industry is headed the US way. One of the crucial points is internet service and more specifically broadband service. This business and revenue growth alternative has been gaining a lot of attention from the cable television industry as an expansion strategy. Higher Average Revenue Per User (ARPU) in India, to the extent of 3 to 5 times the ARPU earned through transmission of television bouquets, certainly makes this service an attractive proposition.


    Comparisons with a mature market like the US may not work in India. Indian cable television players have a long road ahead before any comparison or trying to relate with the industry, in any way could even start to make sense.


    One of the foremost factors is money. According to the National Cable and Television Association, USA (NCTA), the total US broadband industry investments since 1994 is about US$ 1400 billion (4.7 per cent of the US’s estimated revenue for 2014) or 60.7 per cent of India’s nominal GDP of US 2308 billion in April 2015. Money can bridge the technology gap, leapfrog it, as it has in many instances in India.


    Of course, this leads to the oft repeated point about the high cost of implementation of all DAS phases. It is a foregone fact that the capex starved cable television industry with poor balance sheets is going to deploy more money towards that effort if it wants the government to allow it to remain in business. Delays in deadlines may be possible, but in the current scenario, DAS is there to stay and is required for the benefit of all stakeholders.


    Notwithstanding the bureaucracy logjam that India is notorious for, another major stumbling block is the slow and hugely over vamped judicial system (besides regulation) in India that could take years to decide on any dispute. Settling of civil disputes has no deadline in India. The cliché, for businesses, ‘time is money’, holds good here too.


    Let us look at internet services


    The number of internet users worldwide will surpass 3 billion (300 crore) in 2015, according to eMarketer, increasing 6.2 per cent next year to reach 42.4 per cent of the entire world’s population. By 2018, eMarketer estimates, nearly half the world’s population, or 360 crore people, will access the internet at least once each month.  


    eMarketer says that by 2016 India will jump the US as the second-largest internet user population. China leads the world in terms of number of internet users with estimated 66.98 crore users, followed by the US with 25.93 crore and India with 24.23 crore say eMarketer estimates. In 2016, the publication estimates an Indian internet user base of 28.38 crore, higher than the 26.49 crore projections for the US. By 2018, India’s estimated internet subscriber base will be 34.63 crore or probably in the range of about 25-28 per cent of the population of the country at that time. Indian population figures for 2013 are an estimated 125.2 crore. Current population estimates for the US are about 32 crore, or the US has an internet density percentage of about 80, while China’s internet density percentage is about 50 and India just under 20.


    “Inexpensive mobile phones and mobile broadband connections are driving internet access and usage in countries where fixed internet has been out of reach for consumers, whether that’s due to lack of infrastructure or affordability,” said eMarketer senior forecasting analyst  Monica Peart. “While highly developed markets are nearly saturated in terms of internet users, there’s significant room for growth in emerging ones; for example, India and Indonesia will both see double-digit growth in each year between now and 2018.”


    The growing youth population is another important driver, as the most technologically savvy, and their demands shape internet development itself, says a Euromonitor report.


    According to the Telecom Regulatory Authority of India (TRAI), India had a wireline broadband subscriber base (speed greater than 512 kpbs) of 155.2 lakh and 852.3 lakh wireless broadband subscribers as on 30 April, 2015 or 1007.6 lakh broadband subscribers totally. This means that less than 1 per cent of the total population of the country has broadband. There is no denying the fact that the potential is huge, more so for broadband.


    Siti Cable (Siti), a multi system operator (MSO), believes that its strategy of cross-selling broadband services to its existing cable television subscribers and new customers will provide it with an opportunity to increase ARPUs, increase retention rates, ensure higher sustainable EBITDA margins and leverage upon its existing pan India presence.


    A few players such as medium sized MSO Atria Convergence Technologies (ACT) had actually changed its strategy since 2012 and started focusing more on broadband services, without losing focus on its MSO operations. It offers broadband internet in areas where it does not have cable subscribers. Despite being a regional player, ACT is the second largest private wired broadband player in the country, just after the mobile telecom behemoth Airtel. ACT’s broadband subscriber base has grown by 43.76 per cent to 6.11 lakh in the 12 months until 31December, 2014. As on 30 April, 2015, ACT had a wired broadband subscriber base of 6.8 lakh.


    However, ACT has followed a different strategy when compared to the other MSOs who use DOCSIS on the existing television cable for internet delivery. The company has laid separate optic fibre lines for internet delivery and hence owns even the last mile, rather than use its existing cable infrastructure and be dependent upon the LCOs’ whims and fancies.


    It must also be noted that the number of internet subscribers that each major cable television player in the US has runs in crores in a couple of cases. The largest MSO in India in terms of cable subscribers – Den Networks, with about 130 lakh subscribers has less than half the customer relationships that Comcast’s Cable Communications segment has with 272.34 lakh subscribers, of which about 223.75 lakh are video subscribers and 223.69 lakh are high speed internet subscribers. While Den’s cable subscriber base is about 58 per cent of Comcast Cable Communications segment, its internet subscriber base as on 31 March, 2015, is a small fraction at just 23,000 or just a little more than one thousandth of the internet subscribers that Comcast has. Even, ACT’s internet subscriber base of about 7 lakh is less than one-thirtieth of Comcast’s Cable Communications High-Speed internet subscribers. Is there any comparison?


    According to Nielsen’s 2015 Advance National TV Household Universe Estimate (UE), there are 11.64 crore TV homes in the U.S. prior to the start of the 2014-15 TV season. The number of homes represents a 0.5 per cent increase from Nielsen’s 2013-14 TV Household Universe Estimate. The number of persons aged 2 and older in U.S. TV Households is estimated to be 29.6 crore—also an increase of 0.5 per cent from last year. This puts the number of subscribers in the previous year as per Nielsen’s estimates at 11.58 crore.  The Indian carriage universe has 16.8 crore homes (44.3 per cent more than the estimated US TV homes) according to the FICCI- KPMG Indian Media and Entertainment Industry Report 2015. (FICCI-M&E 2015 report).


    The number of video subscribers through wire in the US as of 2013 was about 6.6 crore or the country had a cabletelevision percentage density just under 21. India has a TV home (TV Households or TV HH) density percentage of a little less than 13.5 (this includes DTH for India).


    Besides a number of cable television and IPTV service providers, the US has two big DTH players – Dish and Directv that had a combined subscriber base in Q1-2015 of approximately 341 lakh, or about 29 per cent of the total TV homes in the US estimated by Nielsen. India had an active DTH subscriber base of about 405.4 lakh (24.3 per cent of TV HH in India) as on 31 December, 2014.


     As mentioned above, in India, internet services ARPU is much higher than the ARPU from cable television services as compared to more mature markets such as the US, where it is the other way around. At the time of writing of this report, internet services monthly ARPU could be between 50 to 65 per cent of the video monthly ARPUs’ in the US. Video monthly ARPU would typically be in the range of US$ 75 to US$ 95, while internet monthly ARPU would range between US$ 40 to US$ 50. Is there an ARPU comparison? No way!


    Let us look at three players in the US. The entities in this report – Comcast Corporation’s Cable Communications segment, Time Warner Cable (TWC, about half the size of Comcast Cable Communications segment) and Charter Communications (Charter Comm) (About half the size again of TWC) represent about 32 per cent of the total US TV homes estimated by Nielsen.


    In Q1-2015, these entities combined video subscribers dropped by 6.12 lakh (1.61 per cent) to 373.47 lakh (32.09 per cent of Nielsen’s estimated TV Homes) from 379.59 lakh (32.77 per cent of Nielsen’s estimated TV Homes) in Q1-2014. Individually too, all the three entities reported loss of video subscribers in Q1-2015 to the extent of 1 per cent in the case of Comcast and Charter Comm and 3.08 per cent in the case of TWC, as compared to the corresponding year ago quarter. Despite the drop in video subscribers, the other two reported an increase in revenue from video in Q1-2015, while TWC even saw its video revenues drop by 1.04 per cent in Q1-2015 as compared to Q1-2014.


    The total number of internet subscribers of these three entities exceeded the total number of video subscribers in Q1-2015– internet subscribers grew to 392.5 lakh (5.1 per cent more than video subscribers) as compared to 369.45 crore (2.67 per cent less than video subscribers) in Q1-2014. All the three players reported increases in their internet subscription base as well as revenue from Internet in Q1-2015 when compared to the year ago quarter.


    Triple play (or triple product) subscribers increased in all the three cases, between 0.61 per cent in the case of Charter Comm to 14.49 per cent in the case of TWC and 4.26 per cent in the case of Comcast in Q1-2015 when compared to Q1-2014. TWC and Charter Comm’s double play subscriber base shrank 8.05 per cent and 0.6 per cent respectively, while Comcast’s double play subscription numbers increased in comparison during similar periods.


    Notes: (1) 100,00,000 = 100 lakh = 10 million = 1 crore


    (2) Revenues for US companies and some figures in this report have been mentioned in US$, million; subscription numbers in lakh or crore and TV homes in crore.


    (2) SARPU, a term similar to ARPU has been coined by the writer to bring terms to a common denominator for all the three US entities. To arrive at SARPU, the writer has added the quarterly revenues from each stream and divided the result by the number of customer relationships in that quarter and further divided the second result by 3 to arrive at a rough estimate of the revenue earned per relationship per month by the entity. Similarly, individual revenues from video, internet and voice streams/business have been divided by the number of subscribers of video, internet and voice streams respectively, further divided by 3 to arrive at an SARPU of that stream. Residential subscriber numbers have been used wherever available.


    (2.1) VIVE, another term coined by the writer, means video, internet and voice, the three main revenue generating streams or businesses for the three US entities in this report.


    (3) Voice numbers has been included, since there are number of overlaps in subscription numbers for VIVE of all the three entities.


    (4) ARPUs’ and SARPUs’ in this report are on a monthly basis unless stated otherwise.


    Comcast Cable Communications segment


    Comcast’s Cable Communications segment’s (probably the largest cable company and home internet services provider in the US) comprises 272.34 lakh relationships in Q1-2015 (quarter ended 31 March, 2015). The number grew by just 1.62 per cent from the 268 lakh in Q1-2014, and was driven by increases in double and triple product relationships.  This is what the cable industry in India is trying to ape – the double and triple play numbers.


    The breakup of these customers is 83.99 lakh single product, 2.39 per cent lower than the 86.05 lakh in Q1-2014; 88.90 lakh double product, 2.7 per cent more than the 86.56 lakh double product consumers in Q1-2014 and 99.45 lakh triple product consumers, 4.26 per cent more than the 95.39 lakh in  Q1-2014.


    The breakup of number of Comcast’s cable operations customers base on products is 223.75 lakh of video consumers in Q1-2015 – the number fell by 8000 as compared to the corresponding year ago quarter; 223.69 lakh high-speed internet consumers – the number increased by 4.07 lakh as compared to Q1-2014; and 112.70 lakh voices consumers – the number increased by 77000 as compared to the previous year ago quarter.


    Based on the financials filed by the company for Q1-2015, 69.16 per cent of the company’s consumers’ use two (double play) or more of its products, (up 127 basis points or 1.87 per cent higher) than the 67.89 per cent in Q1-2014.


    Let us examine the revenue that these businesses bring in for the company:


    Comcast’s Cable Communications segment revenue in Q1-2015 grew 6.26 per cent to US$ 11430 million from US$ 10757 million in Q1-2014. Combined revenue from Video, Internet and Voice (VIVE) businesses in Q1-2015 grew 4.89 per cent to US$ 9281 million (81.20 per cent of Cable Communications segment revenue) from US$ 8848 million (82.25 per cent Cable Communications segment revenue) in Q1-2014.


    Video revenue in Q1-2015 was US$ 5331million (57.44 per cent of VIVE revenue), 2.95 per cent more than the Rs 5178 million (58.52 per cent of VIVE revenue) in Q1-2014; Internet revenue in Q1-2015 grew 10.69 per cent to US$ 3044 million (32.80 per cent of VIVE) from US$ 2750 million (31.08 per cent of VIVE) in Q1-2014. Voice revenue fell 1.52 per cent in Q1-2015 to US$ 906 million (9.6 per cent of VIVE revenue) from US$ 920 million (10.4 per cent of VIVE revenue) in Q1-2014.


    A simple back of the envelope calculation as mentioned in Note 2 above shows the simple average monthly revenue per user (SARPU) of US$ 113.60 for Q1-2015, up 3.22 per cent as compared to the US$ 110.05 in Q1-2014.


    Similarly, Video SARPU grew 3.99 per cent in Q1-2015 to US$ 79.42 from US$ 76.37 in Q1-2014; Internet services SARPU grew 4.25 per cent to US$ 45.36 (56.97 per cent of video SARPU) in Q1-2015 from US$ 43.51 (57.12 per cent of video SARPU) in Q1-2014; Voice SARPU fell 5.06 per cent to US$ 26.80 from US$ 28.23 in the year ago quarter.


    Time Warner Cable


    Let us see how another big player in the US performed – Time Warner Cable (TWC).  In Q1-2015 the company saw its highest q-o-q growth in internet subscriber base since 2007 by 3.15 lakh to 119.90 lakh from 116.75 lakh in the quarter ended 31 December, 2014. Y-o-y, the company’s internet subscriber base grew by 6.32 lakh. However, the company’s video subscribers fell 3.08 per cent in Q1-2015 to 108.19 lakh from 111.63 lakh in Q1-2014. Voice subscribers increased 14.06 per cent in Q1-2015 to 56.04 lakh from 49.13 lakh in Q1-2014. TWC’s customer relationships increased 1.27 per cent in Q1-2015 to 147.16 lakh from 145.32 lakh in Q1-2014.


    In Q1-2015, the number of consumers using TWC’s double or triple play increased by 64 basis points (up 1.05 per cent) to 61.45 per cent from 60.81 per cent.


    TWC’s overall revenue in Q1-2015 grew 2.06 percent to US$ 4662 million from US$ 4568 million in Q1-2014. Its VIVE revenue in Q1-2015 grew 1.96 per cent to US$ 4638 million (99.49 per cent of overall revenue) from US$ 4549 million (99.58 per cent of overall revenue) in Q1-2014.


    Video revenue fell 1.04 per cent in Q1-2015 to US$ 2469 million (53.23 per cent of VIVE revenue) from US 2495 million (54.85 per cent of VIVE revenue); Internet revenue grew 8.86 per cent to US$ 1696 million (36.57 per cent of VIVE revenue) in Q1-2015 from US$ 1558 million (34.25 per cent of VIVE revenue) in Q1-2014. Voice revenue in Q1-2015 fell 4.64 per cent to US$ 473 million (10.2 per cent of VIVE revenue) from US$ 496 million (10.9 per cent of VIVE revenue).


    TWC’s SARPU per customer relationship was US$ 105.06 in Q1-2015 or 0.68 per cent higher than the US$ 104.34 in Q1-2014.


    TWC’s video SARPU in Q1-2015 increased 2.1 per cent to US$ 76.07 from US$ 74.50 in Q1-2014; Internet SARPU increased 3.12 per cent to US$ 47.15 (61.98 per cent of video SARPU) in Q1-2015 from US$ 45.72 (61.37 per cent of SARPU) in Q1-2014 and Voice SARPU fell 16.4 per cent in Q1-2015 to US$ 28.13 from US$ 33.65 in Q4-2014.


    Charter Communications


    Charter Communications (Charter Com), an even smaller player than Comcast or TWC, reported 4.48 per cent growth in residential consumer relationships in Q1-2015 to 59.27 lakh from 56.73 lakh in Q1-2014. Video subscription base fell 1 per cent to 41.53 lakh (70.07 per cent of total relationships) from 41.95 lakh (73.95 per cent of total relationships) in Q1-2014; Internet subscription base grew in Q1-2015 by 8.23 per cent to 48.91 lakh (82.52 per cent of total relationships, addition of 3.23 lakh subscribers) from 45.91 lakh (79.66 per cent of total relationships) in Q1-2014; Voice subscribers grew 6.71 per cent in Q1-2015 to 24.81 lakh (59.74 per cent of total relationships) from 56.93 lakh (40.98 per cent of total relationships) in the corresponding year ago quarter.


    Overall revenue grew 7.27 per cent to US$ 2362 million in Q1-2015 from US$ 2202 million in Q1-2014. VIVE revenue in Q1-2015 grew 6.68 per cent to US$ 1980 million (83.83 per cent of overall revenue) from US$ 1856 million (84.29 per cent of overall revenue).


    Video revenue increased 3.58 per cent in Q1-2015 to US$ 1129 million (53.23 per cent of VIVE revenue) from US$ 1090 million (54.85 per cent of VIVE revenue) in Q1-2014; Internet revenue increased 16.4 per cent to US$ 717 million (36.21 per cent of VIVE revenue) in Q1-2015 from US$ 616 million (33.19 per cent of VIVE revenue) in Q1-2014. Voice revenue in Q1-2015 fell 10.67 per cent to US$ 134 million (6.77 per cent of VIVE revenue) from US$ 150 million (8.08 per cent of VIVE revenue) in Q1-2014.


    Charter Comm’s SARPU in Q1-2015 increased 2.11 per cent to US$ 111.35 from US$ 109.05 in Q1-2014. Video SARPU increased 4.63 per cent to US$ 90.62 in Q1-2015 from US$ 86.61 in the corresponding year ago quarter; Internet SARPU in Q1-2015 increased 7.54 per cent to US$ 48.87 (53.92 per cent of video SARPU) from US$ 45.44 (52.46 per cent of video SARPU) in Q1-2014; Voice SARPU fell 16.28 per cent in Q1-2015 to US$ 18 from US$ 21.51 in Q1-2014.


    Let us see what the richest Indian does through Reliance Jio Media, for this is probably the only group/entity that has the deep pockets to really offer a shimmer of comparison with the media giants in the US.


    Can we truly compare Cable television internet in India with the industry in the US? No way!

  • Charter’s acquisition bid values Time Warner Cable at $78.7 billion

    Charter’s acquisition bid values Time Warner Cable at $78.7 billion

    MUMBAI: After much speculation, Charter Communications has agreed to acquire Time Warner Cable Inc for a sum of $78.7 billion in cash and stock.


    With this, Time Warner Cable will now merge with Charter to merge with Time Warner Cable. Charter will provide $100 in cash and shares of a new public parent company (“New Charter”) equivalent to 0.5409 shares of CHTR for each Time Warner Cable share outstanding.


    The deal values each Time Warner Cable share at approximately $195.71 based on Charter’s market closing price on 20 May, or approximately $200 based on Charter’s 60-trading day volume weighted average price.


    In addition, Charter will provide an election option for each Time Warner Cable stockholder, other than Liberty Broadband Corporation or Liberty Interactive Corporation, who will receive all stock, to receive $115 of cash and New Charter shares equivalent to 0.4562 shares of CHTR for each Time Warner Cable share they own.


    Charter and Advance/Newhouse Partnership (a parent of Bright House Networks, LLC) have also amended the agreement, which the two parties signed and announced on 31 March, 2015, whereby Charter will acquire Bright House Networks for $10.4 billion. That agreement, as amended, provides for Charter and Advance/Newhouse to form a new partnership of which New Charter will own between approximately 86 per cent and 87 per cent and of which Advance/Newhouse will own between approximately 13 per cent and 14 per cent, depending on the Time Warner Cable shareholders’ cash election option described above. The consideration to be paid to Advance/Newhouse by Charter will include common and convertible preferred units in the partnership, in addition to $2 billion in cash. The common and convertible preferred partnership units will each be exchangeable into shares of New Charter. The Charter-Advance/Newhouse transaction is expected to close contemporaneously with the Charter-Time Warner Cable transaction.


    Moreover, Liberty Broadband Corporation has agreed to purchase, upon closing of the Time Warner Cable transaction, $4.3 billion of newly issued shares of New Charter at a price equivalent to $176.95 per Charter share, which represents Charter’s closing price as of 20 May, 2015. As previously-announced, Liberty Broadband will also purchase, upon closing of the Charter-Advance/Newhouse transaction, $700 million of newly issued Charter shares at a price equivalent to $173.00 per Charter share.


    Following the close of both the Charter-Time Warner Cable and the Charter-Advance/Newhouse transactions, and depending on the outcome of the cash election feature offered in the Charter-Time Warner Cable transaction, Time Warner Cable shareholders, excluding Liberty Broadband and its affiliates, are expected to own between approximately 40 per cent and 44 per cent of New Charter, and Advance/Newhouse is expected to own between approximately 13 per cent and 14 per cent of New Charter. Liberty Broadband is expected to own between approximately 19 per cent and 20 per cent of New Charter.


    The combination of Charter, Time Warner Cable and Bright House will create a broadband services and technology company serving 23.9 million customers in 41 states. The transactions will drive investment into the combined entity’s advanced broadband network, allow for wider deployment of new competitive facilities based WiFi networks in public places, and the footprint expansion of optical networks to serve the large marketplace of small and medium sized businesses.  This will result in faster broadband speeds, better video products, including more high definition channels, more affordable phone service and more competition, for consumers and businesses.


    The scale of the new entity will also result in greater product innovation, bringing new and advanced services to consumers and businesses, including Charter’s Spectrum Guide and World Box and other product innovations. And Charter’s commitment to superior products and outstanding customer service, and its strategy of investing in insourcing and returning offshore jobs to America, will not only benefit the combined companies’ customers, but will also enhance opportunities for employees of the new company.


    “The teams at Charter, Time Warner Cable and Bright House Networks are filled with the innovators of our industry. Representatives of each of these companies have invented some of the most revolutionary communications products ever created; innovations like video on demand, VOIP phone service, remote storage DVR, cable TV through an app, downloadable security and the first backward-compatible, cloud-based user interface. That spirit of innovation will live on, and it will create real benefits and great long-term value for the customers, shareholders and employees of all three companies. With our larger reach, we will be able to accelerate the deployment of faster Internet speeds, state-of-the-art video experiences, and fully–featured voice products, at highly competitive prices. In addition, we will drive greater competition through further deployment of new competitive facilities-based WiFi networks in public places, and the expansion of the facilities footprint of optical networks to serve the large, small and medium sized business services marketplace. New Charter will capitalize on technology to create and maintain a more effective and efficient service model. Put simply, the scale of New Charter, along with the combined talents we can bring to bear, position us to deliver a communications future that will unleash the full power of the two-way, interactive cable network,” said Charter Communications president and CEO Tom Rutledge.


    “With today’s announcement, we have delivered on our commitment to maximizing shareholder value. This agreement recognizes the unique value of Time Warner Cable, and brings together three great companies that share a common philosophy of strong operations, great products, robust network investment and putting customers first. This combination will only accelerate the great operating momentum we’ve seen over the last year and provide enormous opportunities for our 55,000 dedicated employees. We remain wholly committed to bringing the very best experience to our residential and business customers coast to coast,” said Time Warner Cable chairman and CEO Robert D. Marcus.


    “Today’s announcement is good news for customers and potential customers, as well as our employees, since we will be in a stronger position to deliver competitive services, invest in advanced technology, and develop innovative products that will compete with global and national brands. In addition, I am very pleased that Tom Rutledge will be the CEO of the new company. Tom recognizes the importance of placing a high priority focus on customer care drawing from the expertise of all three companies, and I believe this will be a strong pillar of the new company’s culture,” added Bright House Networks CEO Steve Miron.


    Tom Rutledge will serve as president and CEO of New Charter. Additionally, Rutledge will be offered a new five-year employment agreement. At the close of the transactions, New Charter’s Board of Directors will consist of 13 directors including Rutledge, who will be offered the position of chairman. The remaining 12 directors will include seven independent directors nominated by the independent directors serving on Charter’s Board of Directors, two directors designated by Advance/Newhouse, and three directors designated by Liberty Broadband. Charter’s current chairman since 2009, Eric Zinterhofer, will continue to serve on New Charter’s Board.


    Pursuant to the agreement between Charter and Advance/Newhouse, Charter and Advance/Newhouse will form the partnership utilizing an existing subsidiary of Charter Communications Holding Company, LLC, a subsidiary of Charter. New Charter, which will include Time Warner Cable, will contribute substantially all of its assets into the partnership, and Advance/Newhouse will contribute all of Bright House’s assets into the partnership. In exchange for its contribution, Advance/Newhouse will receive $5.9 billion of exchangeable common partnership units, and $2.5 billion of convertible preferred partnership units, which will pay a six per cent coupon. The common and convertible preferred partnership units will each be exchangeable into New Charter Class A common stock, with 34.3 million common units priced at $173.00 (the “Reference Price”) per share, as previously announced. The 10.3 million preferred partnership units will be convertible at $242.19, a 40 per cent premium to the Reference Price. Advance/Newhouse will also receive $2 billion in cash and will receive governance rights reflecting its economic ownership in the partnership through a new class of shares at New Charter.


    Upon closing of the Charter-Advance/Newhouse transaction, a new shareholder’s agreement with Advance/Newhouse and Liberty Broadband will become effective. Under the new agreement, Advance/Newhouse and Liberty Broadband will be granted preemptive rights, allowing each to maintain their pro rata ownership in New Charter. The shareholder’s agreement also provides for voting caps and required participation in buybacks at specified acquisition caps, and stipulates transfer restrictions among other shareholder governance matters. In connection with the Charter-Advance/Newhouse transaction as amended, Advance/Newhouse has agreed to grant Liberty Broadband a voting proxy on its shares, capped at seven per cent, for the five years following the close of the transaction, such that Liberty Broadband would have total voting power of approximately 25 per cent at closing. The proxy excludes votes on certain matters.


    The Charter-Advance/Newhouse transaction is subject to several conditions, including the completion of the Time Warner Cable acquisition (subject to certain exceptions if Time Warner Cable enters into another sale transaction) and a separate vote on the Liberty transactions, and regulatory approval. The three companies expect to close the announced transactions by the end of 2015.

  • FY-2014: Charter Communications reports loss of $183 million

    FY-2014: Charter Communications reports loss of $183 million

    BENGALURU: US cable television, high-speed Internet, and telephone services company Charter Communications, Inc (Charter) reported 5.7 per cent lower loss at $183 million for FY-2014 as compared to the $194 million in FY-2013. For the quarter ended December 31, 2015 (Q4-2014, current quarter) the company reported loss of $48 million versus a net income of $39 million in the corresponding year ago quarter.


     For the year ended 31 December, 2014, revenues rose to $9.1 billion, 8.2 per cent higher on a pro forma basis than in 2013, driven by continued growth in Internet, video and commercial revenues. On an actual basis, full year 2014 revenues rose 11.7 per cent year-over-year. 


    Fourth quarter 2014 revenues rose to $2.4 billion, 9.9 per cent higher than the year-ago quarter, driven primarily by growth in Internet, video and commercial revenues says the company. 


    Video revenues totalled $1.1 billion in the fourth quarter, an increase of 8.1 per cent compared to the prior year period. Video revenue growth was driven by higher expanded basic and digital penetration, annual and promotional rate adjustments, higher advanced services penetration, and revenue allocation from higher bundling, partially offset by a decrease in residential limited basic video customers.


    Internet revenues grew 13.5 per cent compared to the year-ago quarter to $670 million, driven by an increase of 383,000 Internet customers during the last year and by promotional rolloff, legacy price adjustments and revenue allocation from higher bundling.


    Voice revenues totalled $139 million, a decline of 9.7 per cent versus the fourth quarter of 2013, due to value-based pricing and revenue allocation from higher bundling, partially offset by the addition of 166,000 voice customers in the last twelve months.


    Commercial revenues rose to $262 million, an increase of 16.1 per cent over the prior-year  period, and was driven by higher sales to small and medium business customers and to carrier customers. 


    Fourth quarter advertising sales revenues of $107 million increased 28.9 per cent compared to the year ago quarter, primarily driven by an increase in political advertising revenue. Excluding the benefit of political advertising revenue generated in the fourth quarter of 2014, and during the corresponding prior-year period, total fourth quarter advertising sales revenues grew by approximately 8.9 per cent year-over-year.


    Customer numbers 


    During the fourth quarter of 2014, Charter’s residential customer relationships grew by 73,000, with triple play sell-in improving year-over-year, to 62 per cent of total residential video sales. Commercial customer relationships grew by 6,000 in the fourth quarter of 2014. Residential PSUs increased by 157,000, while commercial PSUs increased 14,000 during Q4-2014.


    During Q4-2014, Charter says that it continued to introduce its new product suite, Charter Spectrum, in markets that were recently converted to all-digital. Charter customers in these markets now have access to an industry-leading suite of video, data, and voice services that includes over 200 HD channels, in addition to minimum offered Internet speeds of 60 Mbps, and a fully featured voice service, delivered at a highly competitive price. Charter Spectrum is available to new Charter customers, and to existing customers within the Company’s new pricing and packaging structure launched in 2012. As of the end of Q4-2014, the company claims that 86 per cent of residential customers were in Charter’s new pricing and packaging, excluding customers in the former Bresnan properties.


    Residential video customers increased by 3,000 in Q4-2014, versus a loss of 2,000 in the year-ago period. For the past two years Charter says that it has significantly increased the competitiveness of its video product, by including more HD channels and video on demand offerings, attractive packaging of advanced services, improved selling methods, and enhanced service quality.


    Charter added 104,000 residential Internet customers in Q4-2014, compared to 93,000 a year ago. As of December 31, 2014, 80 percent of Charter’s residential Internet customers subscribed to tiers that provided speeds of 60 Mbps or more informs Charter.


    During the Q4-2014, the company added 50,000 residential voice customers, versus a gain of 56,000 during Q4-2013. Fourth quarter residential revenue per customer relationship totalled $111.52, and grew by 3.1 per cent as compared to the prior-year period, driven by rate adjustments, higher product sell-in and promotional rate step-ups, partially offset by continued single play Internet sell-in and bulk digital upgrades. In September 2014, Charter increased its broadcast TV surcharge. Excluding this rate adjustment, residential revenue per customer relationship grew by 2.2 per cent year-over-year.

  • Time Warner shareholders to vote today for share swap and Comcast merger

    Time Warner shareholders to vote today for share swap and Comcast merger

    BENGALURU: Comcast Corporation (Comcast) announced yesterday that, at its special meeting of shareholders held at The Kimmel Centre for The Performing Arts in Philadelphia, more than 99 per cent of Comcast shareholders voting supported Comcast’s proposal to issue 2.875 shares of Comcast class A common stock for every one share of Time Warner Cable common stock in connection with Comcast’s proposed merger with Time Warner Cable.

     
    The merger between Comcast and Time Warner Cable is subject to various regulatory approvals and other customary conditions and also requires approval by Time Warner Cable shareholders, who are expected to vote on the merger today, 9 October 2014.  Subject to satisfaction of these conditions, the merger is expected to close in early 2015, says Comcast.

     
    If the deal closes, the combined firm would serve 30 per cent of US cable TV households and about 40 per cent of US homes that have broadband internet service.

     
    In addition, Comcast will sell 1.4 million Time Warner Cable subscribers to Charter Communications for about $7.3 billion. Comcast would also divest 2.5 million subscribers to a new public company which will be owned 66 per cent by Comcast shareholders, and 33 per cent by Charter, which will manage its network and customers. Finally, Comcast and Charter will swap about 1.6 million subscribers with each other.