Tag: broadband

  • FCC gets Indian origin Ajit Pai as its chairman

    FCC gets Indian origin Ajit Pai as its chairman

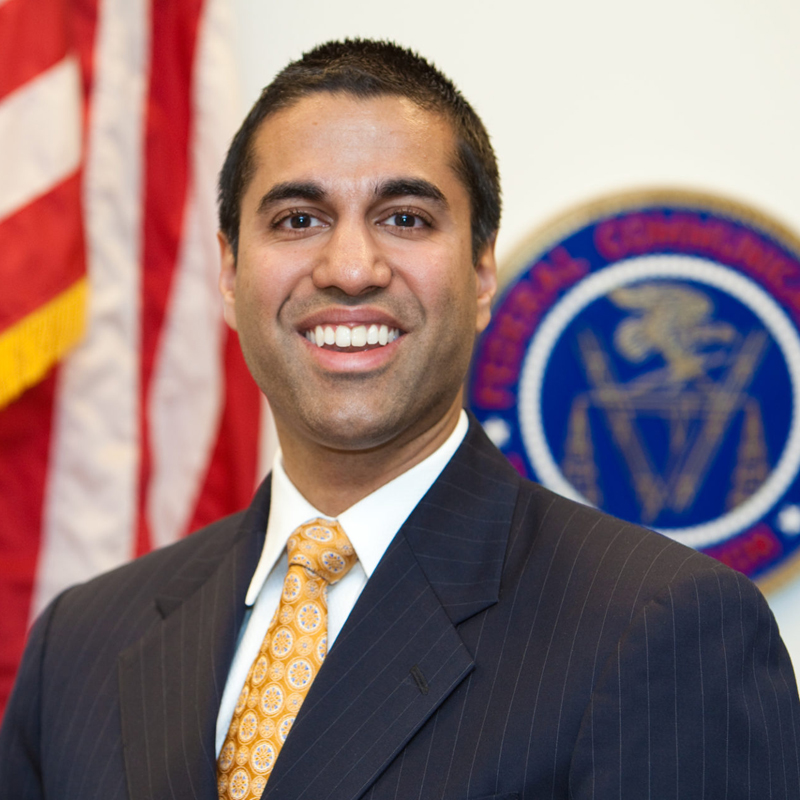
    MUMBAI: Indians are familiar with Ajit Pai who addressed Ficci Frames as a keynote speaker just three years ago. But Pai is the point man designated by US president Donald Trump as the 34th chairman of the Federal Communications Commission (FCC) who will be drawing up communications policy in one of the most highly networked and communications heavy nations on earth.

    Pai, a senior republican on the FCC, was appointed as a commissioner in 2012 by the then President Barack Obama and later confirmed by the senate. He replaces outgoing chairman Tom Wheeler.

    “I look forward to working with the new administration, my colleagues at the Commission, members of Congress and the American public to bring the benefits of the digital age to all Americans,” Pai said in a statement.

    Ajit Pai had credited his family for his successful rise as communications regulator during his Ficci Frames speech: Said he: “I was born and brought up in the United States, but my family’s roots are here in India. My mother grew up in Bangalore, and my father was raised in Hyderabad. In 1971, they came to the United States with just a radio and ten dollars in their pockets. Now, forty-three years later, here I am, in the country of my forefathers, speaking to you as the first Indian-American to serve on the FCC. The credit for this goes to my parents, who, like many immigrants, sacrificed to give me opportunities not available to them as children. It goes to my grandparents, who instilled in my parents the value of hard work and the vision to dream big.”

    According to the FCC website Pai’s rules on communication regulations are as follows:

    * Consumers benefit most from competition, not preemptive regulation. Free markets have delivered more value to American consumers than highly regulated ones.

    * No regulatory system should indulge arbitrage; regulators should be skeptical of pleas to regulate rivals, dispense favors, or otherwise afford special treatment.

    * Particularly given how rapidly the communications sector is changing, the FCC should do everything it can to ensure that its rules reflect the realities of the current marketplace and basic principles of economics.

    * As a creature of Congress, the FCC must respect the law as set forth by the legislature.

    * The FCC is at its best when it proceeds on the basis of consensus; good communications policy knows no partisan affiliation.

    Pai as the commissioner had proposed a:

    * Comprehensive plan to promote broadband deployment to all Americans. The federal government must make it easier to for broadband providers to retire increasingly obsolete copper lines in favor of next-generation technologies like fiber.”

    • It must enable rural residents to have the same choice for stand-alone broadband typically found in cities.

    • It must create a roadmap for state and local governments so that companies that want to compete in the broadband market don’t have to jump through unnecessary regulatory hoops in order to lay fiber to consumers.

    • It must promote common-sense policies like “Dig Once” and reform pole attachment rules to reduce the costs of building digital networks.

    • It must streamline the process for deploying wireless infrastructure, from big towers to small cells.

    • It must free up more licensed spectrum for use by wireless carriers and more unlicensed spectrum for things like Wi-Fi.

    • And it must preserve Internet freedom here and abroad, so that the online world can flourish free from heavy-handed government intervention.

    Additionally, Pai ai was the first member of the FCC in over two decades to call for revitalizing the AM radio band; the basic reforms he proposed were adopted in 2015. He also urged the FCC to create a task force to study the “Internet Protocol Transition” and report on obsolete rules that could be repealed; that task force was created.

    He is likely to undo the net neutrality regime that the FCC had been pursuing under outgoing chairman Wheeler.

  • Q3-17: Den Networks reports higher ARPUs, subscription revenue & operating profits

    Q3-17: Den Networks reports higher ARPUs, subscription revenue & operating profits

    BENGALURU: Following the 26.7 percent year-over-year (y-o-y) increase in the previous quarter, multiple-systems operator (MSO) Den Networks Limited (Den) reported 29.7 percent y-o-y increase in consolidated Total Income from operations (TIO) for the quarter ended December 31, 2016 (Q3-17, current quarter) as compared to the corresponding year ago quarter (Q3-16). The company also reported a 75.1 percent quarter-over quarter (q-o-q) increase in consolidated operating profit (EBIDTA) to Rs 50.34 crore (18.7 percent margin) from Rs 28.75 crore (10.6 percent margin) in the current quarter. In the corresponding year ago quarter Den had reported an operating loss (negative EBIDTA) of Rs 39.56 crore. Den’s TIO for the current quarter was Rs 298.83 crore as compared to Rs 230.39 crore in Q3-16. EBIDTA including other income was Rs 62.60 crore (22.3 percent margin of TIO) in Q3-17 as opposed to an operating loss (including other income) of Rs 27.03 crore in Q3-16.

    Further the company reported lower losses for the current quarter as compared to the corresponding year ago quarter. Net loss after tax (PAT) reduced to Rs 45.19 crore in Q3-17 as compared to a loss of Rs 87.39 crore in Q3-16. Total Comprehensive Income (TCI) improved to a negative Rs 44.39 crore in Q3-17 as compared a negative Rs 87.18 crore in Q3-16.

    Said DEN Networks CEO SN Sharma: “The company continues to improve on cable subscription billing on a quarter on quarter basis. ARPU (including taxes) for DAS 1, 2 and 3 markets stood at Rs 125, Rs. 95 and Rs. 64 per box respectively which reflects on improvement of 11 per cent , 6 per cent and 23 per cent respectively on Q-o-Q basis , with a strong collection efficiency at 95 per cent .”

    Sharma also announced that DEN has  achieved break even in the company’s broadband business for the full quarter despite telecom launches and freebies offered by the big players.

    Segment numbers

    The company has two operating segments that contribute to revenue for now– Cable Distribution Network (Cable) and Broadband (brand Boomband). Both segments reported improved operating numbers. Its third segment – the soccer segment has no revenue as of now. The segment has neither income nor result for the current quarter. That’s because the company is gradually exiting from the business and has divested almost 80 per cent of its equity in the team.

    Cable segment reported 35.4 percent growth in operating revenue in Q3-17 at Rs 277.36 crore as compared to Rs 204.84 crore in Q3-16. The segment’s operating loss in the current quarter improved significantly to Rs 11.68 crore as compared to higher operating loss of Rs 43.90 core in Q3-16 and an operating loss of Rs 31.22 crore in the immediate trailing quarter.

    Broadband segment revenue increased 82.6 in the current quarter to Rs 21.47 crore as compared to Rs 11.76 crore in Q3-16. The segment reported lower standalone operating loss in Q3-17 of Rs 7.22 crore as compared to an operating loss of Rs 19.77 crore in the corresponding year ago quarter.

    Let us look at the other numbers reported by Den

    Other Income in Q3-17 declined 2.2 percent to Rs 12.26 crore as compared to Rs 12.53 crore in Q3-16

    Total Expenditure in the current quarter was 0.8 percent lower at Rs 317.73 crore (118.2 percent of TIO) as compared Rs 320.17 crore (162.6 percent of TIO) in Q3-16.

    A major cost head for Den is Content Costs which increased 3.5 percent to Rs 119.28 crore (44.4 percent of TIO) in Q3-17 from Rs 115.27 crore (58.5 percent of TIO).

    Other Expenses reduced 26.9 percent in the current quarter to Rs 84.44 crore (31.4 percent of TIO) as compared to Rs 115.49 crore (58.7 percent of TIO) in Q3-16.

    Placement fees increased 2.9 percent in the current quarter to Rs 11.82 crore (4.4 percent of TIO) as compared to Rs 11.49 crore (5.8 percent of TIO) in the corresponding year ago quarter.

    Employee benefits expense in Q3-17 increased 17.3 percent to Rs 32.95 crore (12.3 percent of TIO) as compared to Rs 28.10 crore (14.3 percent of TIO) in Q3-16.

    Finance costs in the current quarter increased 9 percent to Rs 20.44 crore (7.6 percent of TIO) as compared to Rs 18.75 crore (9.5 percent of TIO) in Q3-16.

    Note: (1) All numbers mentioned in this report are standalone unless stated otherwiserigh.

    (2)The unit of currency in this report is the Indian rupee – Rs (also conventionally represented by INR). The Indian numbering system or the Vedic numbering system has been used to denote money values. The basic conversion to the international norm would be:

    (a) 100,00,000 = 100 lakh = 10,000,000 = 10 million = 1 crore.

    (b) 10,000 lakh = 100 crore = 1 arab = 1 billion.

  • Global OTT may expand at 14.5 per cent CAGR

    Global OTT may expand at 14.5 per cent CAGR

    MUMBAI: Over-the-top (OTT) content is the delivery of audio, video, images, and other media over the internet and bypasses traditional content distribution services. OTT services are mostly related to communication and media and are generally lower in cost than the traditional method of content delivery. OTT content, applications, and services are increasingly being adopted in all segments of commerce and society and are affecting and disrupting traditional industries at a significant pace.

    Consumers use online video instead of traditional television; online communications platforms instead of traditional telephone services; and today are able to download films and music that were once provided only on physical media. Additionally, the process of advertising and searching for services is increasingly moving to these online platforms. This has led to an exponential market growth globally. The global OTT content market is estimated to be valued at US$ 53.2 Bn by the end of 2016 and is expected to register a CAGR of 14.5% during the forecast period (2016–2026).

    Top OTT content market players are developing innovative marketing and distribution channels to enter and rule untapped markets. Some of the top companies operating in the global OTT content market include Akamai Technologies, Amazon.com Inc., Apple Inc., Facebook Inc., Google Inc., IBM, LeEco, Limelight Networks, Microsoft Corporation, and Netflix Inc. Several Indian companies have also entered the OTT content market in a big way. Some of the Indian OTT content market players include Star India Pvt. Ltd., Zee Entertainment Enterprises Ltd., Spuul, Eros International Plc., and Viacom 18 Media Pvt. Ltd, according to a PRNewswire release.

    Penetration of high speed broadband

    Growth in the penetration of high speed broadband, increasing mobile subscriptions and adoption of mobile connected devices, new features and advanced capabilities in smartphones, attractive pricing, and more content options are some of the major drivers fuelling the growth of the global OTT content market. Also, a shift in viewer preferences from the television format to a more customised, anytime, anywhere content viewing format is also boosting the growth of the global OTT content market.

    However this growth is hampered by factors such as online piracy activities, low bandwidth in emerging countries, lack of offline content availability, and technical challenges faced during OTT content delivery.

    Video content

    Video content type segment projected to be the most attractive segment over the forecast period. In terms of revenue, the video segment is anticipated to register a relatively higher CAGR of 15.8% between 2016 and 2026. This growth is attributed to extensive growth of high speed broadband infrastructure in emerging economies and popularity of subscription-based models in developed economies. This segment is expected to register high Y-o-Y growth rates throughout the forecast period.

    TVOD revenue model segment expected to register high Y-o-Y growth rates throughout the forecast period. The TVOD segment is estimated to register a CAGR of 15.8% during the forecast period. The AVOD segment is expected to witness significant revenue growth due to its ease of use; personalized, modern interface; and better viewing experience of AVOD services.

    Smartphones and Tablets

    Smartphones and Tablets device / platform type segment projected to be the most attractive segment over the forecast period. The smartphones and tablets segment accounted for a relatively high market value share in 2015 and this segment is anticipated to remain dominant through 2026. The dominance of the smartphones and tablets segment is attributed to increasing consumer preference towards these devices for availing OTT services such as video and audio streaming, social networking, and texting. The Smart TVs segment is expected to register high Y-o-Y growth rates throughout the forecast period and is anticipated to register a CAGR of 18.7% between 2016 and 2026.

    APEJ and Latin America

    APEJ and Latin America expected to be the fastest growing markets over 2016–2026. The APEJ OTT content market is projected to be the most attractive regional market in the global OTT content market and is anticipated to witness a CAGR of 24.6% over the forecast period. The market in North America accounted for a relatively high value share in 2015.

  • Wi-fi proliferation, Net Telephony discussion in January

    Wi-fi proliferation, Net Telephony discussion in January

    NEW DELHI: The open house discussion in the capital on the Telecom Regulatory Authority of India’s consultation paper on “Proliferation of Broadband through Public Wi-Fi Networks” which was earlier slated for 20 December has now been rescheduled for 9 January 2017 to get greater participation in view of the importance attached to public Wi-Fi systems.

    The issuance of this paper on 13 July 2016 was followed by reactions and then a workshop in Bengaluru.

    Through a set of 12 questions, the Authority had sought to get the opinion of stakeholders including internet and telecom service providers on how best Wi-fi (an acronym for Wireless Fidelity) can grow in the country.

    At the outset, the regulator had noted that the growth of Internet penetration in India and realisation of its full potential is closely tied to the proliferation of broadband services. “Broadband” is currently defined to mean a data connection that is able to support interactive services, including Internet access, with the capability of a minimum download speed of 512 kbps. It therefore refers to a means of delivering high-speed Internet access services.

    Later, on 16 November, TRAI issued a second paper on model for nation-wide interoperable and scalable wi-fi networks.

    Earlier, TRAI had said it realised the importance of public Wi-Fi networks as complementary to existing landline and cellular mobile infrastructure in improving broadband penetration and adoption of Digital India.

    Meanwhile, TRAI has also scheduled on 12 January 2017 an open house discussion on internet telephony based on its paper of 22 June 2016 issued after noting that unified IP based backbone and the benefits associated with the converged telecom access scenario has enabled service providers to launch more and more converged services such as Internet Telephony, IPTV, Mobile TV etc. In the Consultation Paper, Trai had also pointed out that use of Internet Protocol (IP)-based networks, including the Internet, continues to grow around the world due to the multitude of applications it supports and particularly due to Voice Over IP (VoIP). IP-based networks are capable of providing real-time services such as voice and video telephony as well as non real-time services such as email and are driven by faster Internet connections, widespread take-up in broadband and the emergence of new technologies.

    Also read:

    Public Wi-Fi: TRAI plans to evolve model, releases paper

    Wi-fi proliferation: Discussion on 20 Dec

    TRAI gives 2nd extension to Internet telephony consultation


  • Wi-fi proliferation: Discussion on 20 Dec

    Wi-fi proliferation: Discussion on 20 Dec

    NEW DELHI: In view of the importance attached to public Wi-Fi systems, the Telecom Regulatory Authority of India will be holding an open house discussion on 20 December 2016 in the capital on its consultation paper on “Proliferation of Broadband through Public Wi-Fi Networks” issued on 13 July 2016.

    The issuance of this paper was followed by reactions and then a workshop in Bengaluru.

    Through a set of 12 questions, the Authority had sought to get the opinion of stakeholders including internet and telecom service providers on how best Wi-fi (an acronym for Wireless Fidelity) can grow in the country.

    At the outset, the regulator had noted that the growth of Internet penetration in India and realisation of its full potential is closely tied to the proliferation of broadband services. “Broadband” is currently defined to mean a data connection that is able to support interactive services, including Internet access, with the capability of a minimum download speed of 512 kbps. It therefore refers to a means of delivering high-speed Internet access services.

    Later, on 16 November, TRAI issued a second paper on model for nation-wide interoperable and scalable wi-fi networks.

    Earlier, TRAI had said it realised the importance of public Wi-Fi networks as complementary to existing landline and cellular mobile infrastructure in improving broadband penetration and adoption of Digital India.

    The objective of the new paper issued last month posing six questions was two-fold:

    a) To explore whether the model proposed in this Note can be incorporated in Public Wi-Fi networks to promote appropriate monetization and business models for sustainable and scalable infrastructure deployment.

    b) To explore the roles of different stakeholders in the Public Wi-Fi network value chain and build an ecosystem for promoting scalable and sustainable partnerships for large scale nation wide deployment.

    Also read:

    Public Wi-Fi: TRAI plans to evolve model, releases paper


  • Broadband rose 8.3 per cent till June 16; teledensity fell in urban, hike in rural

    Broadband rose 8.3 per cent till June 16; teledensity fell in urban, hike in rural

    MUMBAI: The number of telephone subscribers in India increased from 1,058.86 million at the end of Mar-16 to 1,059.86 million at the end of Jun-16, registering a growth of 0.09% over the previous quarter. This reflects year-on-year (Y-O-Y) growth of 5.25% over the same quarter of last year. The overall Teledensity in India declined from 83.36 as on 31 March, 2016 to 83.20 as on 30 June, 2016, according to TRAI statistics.

    Trends in Telephone subscribers and Teledensity in India: Subscription in Urban Areas declined from 609.69 million at the end of Mar-16 to 609.45 million at the end of Jun-16, and Urban Teledensity also declined from 154.01 to 153.22. However, Rural subscription increased from 449.17 million to 450.41 million and Rural Teledensity also increased from 51.37 to 51.41 during the same period.

    Of the total subscription, the share of Rural subscription increased from 42.42% at the end of Mar-16 to 42.50% at the end of Jun-16.

    Composition of Telephone Subscribers: With a net addition of 1.49 million subscribers during the quarter, total wireless (GSM+CDMA) subscriber base increased from 1,033.63 million at the end of Mar-16 to 1,035.12 million at the end of Jun-16, registering a growth rate of 0.14% over the previous quarter. The year-on-year (Y-O-Y) growth rate of wireless subscribers for Jun-16 is 5.54%.

    Wireless Tele-density declined from 81.38 at the end of Mar-16 to 81.26 at the end of Jun-16, according to TRAI statistics.

    Wireline subscriber base further declined from 25.22 million at the end of Mar-16 to 24.74 million at the end of Jun-16, registering a quarterly decline rate of 1.90%. The year-on-year (Y-O-Y) decline rate in wireline subscribers for Jun-16 is 5.38%.

    Wireline Teledensity declined from 1.99 at the end of Mar-16 to 1.94 at the end of Jun-16.

    Total number of Internet subscribers increased from 342.65 million at the end of Mar-16 to 350.48 million at the end of Jun-16, registering a quarterly growth rate of 2.28%. Out of 350.48 million, Wired Internet subscribers are 20.76 million and Wireless Internet subscribers are 329.72 million. Composition of internet subscription.

    The Internet subscriber base of 350.48 million at the end of Jun- 16 comprises Broadband Internet subscriber base of 162.06 million and Narrowband Internet subscriber base of 188.42
    million.

    The broadband Internet subscriber base grew by 8.22% from 149.75 million at the end of Mar-16 to 162.06 million at the end of Jun-16. On the other hand, the narrowband Internet subscriber
    base declined by 2.32% from 192.90 million at the end of Mar-16 to 188.42 million at the end of Jun-16.

    Monthly Average Revenue Per User (ARPU) for GSM service increased by 0.96%, from `125 in QE Mar-16 to `126 in QE Jun-16. Monthly ARPU for GSM service grew by 0.09% on Y-O-Y in this
    quarter, according to TRAI statistics.

    Prepaid ARPU for GSM service per month increased from `107 in QE Mar-16 to `108 in QE Jun-16, and Postpaid ARPU per month increased from `488 in QE Mar-16 to `495 in QE Jun-16.

    On an all India average, the overall MOU per subscriber per month for GSM service declined by 1.07% from 381 for QE Mar-16 to 377 in QE Jun-16.

    Prepaid MOU per subscriber for GSM service declined from 356 in QE Mar-16 to 351 in QE Jun-16, and postpaid MOU declined from 892 in QE Mar-16 to 889 in QE Jun-16.

    Monthly ARPU for CDMA full mobility service declined by 4.86%, from `103.50 in QE Mar-16 to `98.51 in QE Jun-16. Monthly ARPU for CDMA full mobility service declined by 7.95% on Y-O-Y
    basis in this quarter.

    The total MOU per subscriber per month for CDMA full mobility service declined by 12.54%, from 260 in QE Mar-16 to 228 in QE Jun-16. The outgoing MOUs declined from 150 in QE Mar-16 to
    130 in QE Jun-16, and incoming MOUs also declined from 110 in QE Mar-16 to 98 in QE Jun-16, according to TRAI statistics.

    Gross Revenue (GR) and Adjusted Gross Revenue (AGR) of Telecom Service Sector for the QE Jun-16 has been `73,344 Crore and `53,383 Crore respectively. GR and AGR increased by 7.33% and 10.34% respectively in QE Jun-16 as compared to previous quarter.

    The year-on-year (Y-O-Y) growth in GR and AGR over the same quarter in last year has been 12.79% and 13.26% respectively.

    Pass-through charges increased from `19,956 Crore in Q.E. Mar- 16 to `19,961 in Q.E. Jun-16. The quarterly and the year-on-year (Y-O-Y) growth rates of pass-through charges for QE Jun-16 are 0.03% and 11.54% respectively.

    The License Fee increased from `3,872 Crore for the QE Mar-16 to `4,314 Crore for the QE Jun-16. The quarterly and the year-onyear (Y-O-Y) growth rates of license fee are 11.43% and 14.05%
    respectively in this quarter.

    Access services contributed 83.84% of the total Adjusted Gross Revenue of telecom services. In Access services, Gross Revenue (GR), Adjusted Gross Revenue(AGR), License Fee and Spectrum Usage Charges(SUC) increased by 9.20%, 12.21%, 13.55% and 12.42% respectively whereas, Pass Through Charges declined by 0.67% in QE Jun-16, according to TRAI statistics.

    Monthly Average Revenue per User (ARPU) for Access Services based on AGR increased from `126.91 in QE Mar-16 to `140.88 in QE Jun-16.