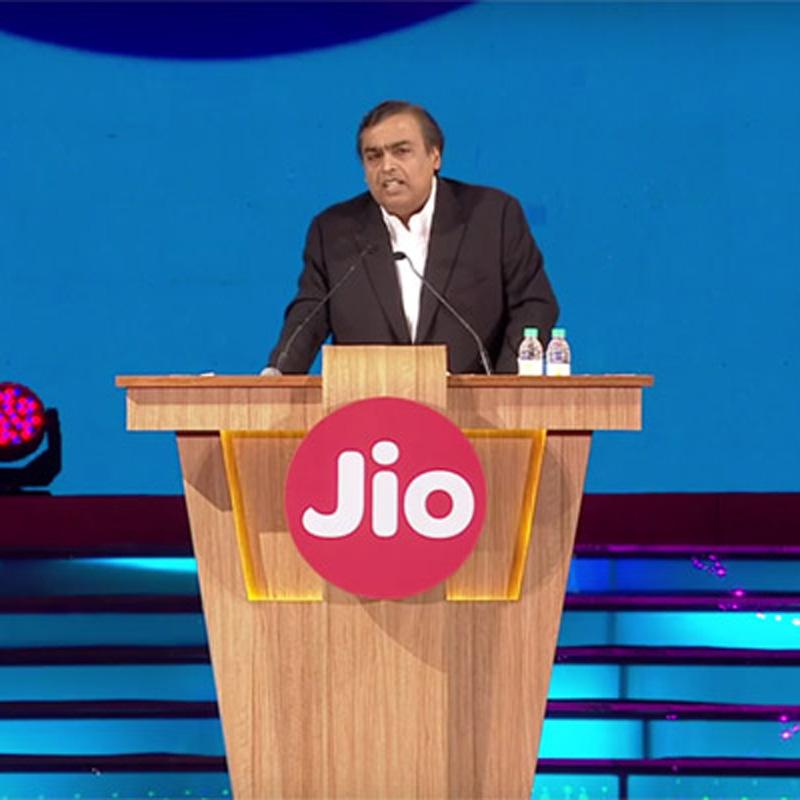
MUMBAI: Loss of revenue on account of competitive pressure catalysed by the extension of Mukesh Ambani-led Reliance Jio free services and demonetisation may cumulatively affect telcos by 5-7 per cent.
RJio recently announced an extension of its free services till 31 March, 2017. Speaking on the impact on the Indian telecom industry, ICRA Limited Associate Head – Corporate Ratings Harsh Jagnani, said: “At a time when the industry is already facing pressures on the operating metrics, owing to heightened competition, the extension of free services by RJio is expected to further push down the realisations in both the voice and the data segments. The impact is expected to be exacerbated by demonetisation of the higher denomination currency, which can lead to revenue loss of the telcos, especially in the pre-paid segment.”
RJio, which launched its services in September 2016 with free voice calling along with lifetime free roaming, provided free unlimited data and a bouquet of mobile applications free till 31 December, 2016, as part of the inaugural offer. Recently, the company announced an extension of its free services till 31 March, 2017.
The tariffs proposed, apart from being disruptive, are not looking at pricing voice and data separately, instead, it is seeing a subscriber holistically and offering bundled packages. The highlight is to develop a market with deep penetration and high consumption, especially for data, thereby targeting high average revenue per user (ARPU) subscribers.
Apart from attractive pricing, other factors which can help RJio build a sizeable subscriber base are – (a) a big bang launch with a novelty factor, (b) a fresh network which gives good service, (c) a strong device ecosystem, and (d) a wide bouquet of content. These can translate into rapid subscriber additions, which would intensify the competition in the sector and increase the subscriber acquisition/retention costs for other operators. Nevertheless, the extent of subscriber addition and service quality delivered by RJio, its pricing strategies in the longer term, and the response by other operators remain watch events for the industry.
ICRA is of the opinion that increasingly the industry would migrate from the revenue per minute (RPM) or the average revenue per megabyte (ARMB) approach to ARPU-based approach.
“At a time when the industry is reeling under a Rs. 4,25,000-crore debt, this extension of free services by RJio has added to the industry’s woes. Heightened competitive pressures would impact the performance of the telcos during the next two quarters i.e. Q3 and Q4 of FY2017. Revenue loss, owing to demonetisation and pressure on operating metrics due to competitive pressures, intensified by extension of free services by RJio, are expected to negatively impact the revenue of the industry by 5-7% during the next two quarters,” Jagnani reiterated.