News Headline
Nielsen adds Big Data muscle to new weekly TV rankings with sports flair
MUMBAI: Nielsen is giving TV viewership a fresh scoreboard with the launch of its revamped weekly ranking reports, now supercharged by Big Data plus Panel measurement.
Unveiled for the first official week of the new broadcast season (starting 22 September), the reports don’t just track traditional programming anymore. Two new lists are in play:Top 25 Live Sports Events and the Top 250 Total Scheduled Programmes across broadcast, cable, streaming and syndication.
Sports wasted no time making a splash in the inaugural rankings, with college football, Major League Baseball, the NFL, Ryder Cup and the WNBA all scoring spots in the Top 25.
The refreshed Nielsen rankers now span broadcast, cable, syndication and streaming, giving a more holistic view of evolving TV habits. The reports shift to total day viewing and cover demographics from households to coveted age brackets like 18–49 and 25–54.
At the heart of this is Nielsen’s Big Data plus Panel system, which blends the company’s long-standing representative panel with viewing data from 45 million households and 75 million devices, including set-top boxes, smart TVs and first-party streaming data. The result? A richer, more precise picture of who’s watching what, when and where.
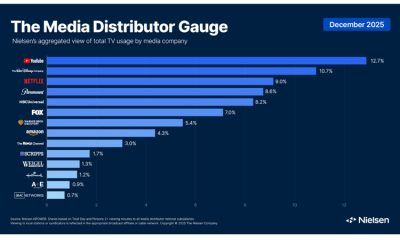
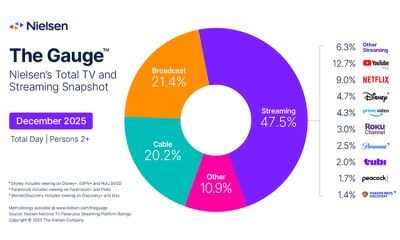
Beyond advertising, these insights can influence content programming, licensing, and TV distribution deals. Nielsen is also folding the new rankings into its website’s Top 10 lists, while continuing to flex its lead in streaming measurement through tools like streaming content ratings and The Gauge.
With Big Data now in play, Nielsen isn’t just reporting on TV, it’s rewriting the playbook for how viewing is measured.


MUMBAI: Netflix is celebrating ten years in India with a slick anniversary film voiced by Shah Rukh Khan, a nostalgic sprint through a decade that rewired how the country watches stories. The campaign doubles as both tribute and reminder: streaming did not just enter Indian homes, it quietly rearranged them.
Roll back to 2016 and television still dictated schedules. Viewers waited weeks, sometimes months, for favourite films to appear on prime time. Family-friendly filters narrowed options further, and piracy often filled the gaps. Then Netflix arrived, softly but decisively, carrying a catalogue of international titles rarely seen in Indian theatres and placing them a click away. Old blockbusters and new releases suddenly coexisted on the same digital shelf.
The platform’s real inflection point came in 2018 with Sacred Games, a breakout series that refused to dilute India’s grit for global comfort. Audiences embraced its unvarnished tone, signalling readiness for stories that did not need box-office validation or censorship compromises. What followed was a steady procession of relatable narratives. Competitive-exam anxiety fuelled Kota Factory. College relationships unfolded in Mismatched. Everyday pressures, not grand spectacle, proved bankable.
Language barriers thinned as foreign series arrived with Hindi, Tamil and Telugu dubbing, expanding viewership beyond urban English-speaking pockets. Marketing mirrored the shift. For global releases such as Squid Game, Netflix leaned on regional creators and influencers to localise buzz and make international content feel native.
The library widened beyond fiction. Documentaries stepped out of festival circuits into living rooms. Stand-up comedians found scale. Established filmmakers, including Sanjay Leela Bhansali with Heeramandi, embraced the platform’s long-form canvas. Subscriber numbers swelled to 12.37 million in India, according to Demandsage, and behaviour followed suit. Late-night binges became routine. Friday release rituals loosened. Watch parties turned solitary screens into social events.
Economics demanded adjustment. Early subscription pricing carried a premium aura that deterred many households. Over time, Netflix recalibrated plans to align with Indian spending sensibilities, conceding that accessibility is as critical as content. To extend momentum around marquee titles, the platform also experimented with split-season releases, stretching anticipation and watch time.
The anniversary film, narrated by Shah Rukh Khan, captures the linguistic shift that mirrors the cultural one: from “Netflix pe kya dekha?” to “Netflix pe kya dekhein?” The question moved from recounting the past to planning the next binge. In ten years, Netflix morphed from foreign entrant to familiar fixture, exporting Indian stories abroad while importing global ones home. The remote no longer waits; it chooses, clicks and moves on. In the streaming age, patience is out, playlists are in, and the next episode is always one tap away.

Gurugram: Delhivery’s boardroom is being reset. Deepak Kapoor, chairman and independent director, has resigned with effect from April 1 as part of a planned board reconstitution, the logistics company said in an exchange filing. Saugata Gupta, managing director and chief executive of FMCG major Marico and an independent director on Delhivery’s board, has also stepped down.
Kapoor exits after an eight-year stint that included steering the company through its 2022 stock-market debut, a period that saw Delhivery transform from a venture-backed upstart into one of India’s most visible logistics platforms. Gupta, who joined the board in 2021, departs alongside him, marking a simultaneous clearing of two senior independent seats.
“Deepak and Saugata have been instrumental in our process of recognising the need for and enabling the reconstitution of the board of directors in line with our ambitious next phase of growth,” said Sahil Barua, managing director and chief executive, Delhivery. The statement frames the exits less as departures and more as deliberate succession, a boardroom shuffle timed to the company’s evolving scale and strategy.
The resignations arrive amid broader governance recalibration. In 2025, Delhivery appointed Emcure Pharmaceuticals whole-time director Namita Thapar, PB Fintech founder and chairman Yashish Dahiya, and IIM Bangalore faculty member Padmini Srinivasan as independent directors, signalling a tilt towards consumer, fintech and academic expertise at the board level.
Kapoor’s tenure spanned Delhivery’s most defining years, rapid network expansion, public listing and the push towards profitability in a bruising logistics market. Gupta’s presence brought FMCG and brand-scale perspective during a period when ecommerce volumes and last-mile delivery economics were being rewritten.
The twin exits, effective from the new financial year, underscore a familiar corporate rhythm: founders consolidate, veterans rotate out, and fresh voices are ushered in to script the next chapter. In India’s hyper-competitive logistics race, even the boardroom does not stand still.

At Locofy.ai, Rao helped convert a three-year free beta into a paid engine, clocking 1,000 subscribers and 15 enterprise clients within ten days of launch in September 2024. The low-code startup, backed by Accel and top tech founders, is famed for turning designs into production-ready code using proprietary large design models.
Before that, Rao founded generative AI venture 1Bstories, which was acquired by creative AI platform Laetro in mid-2024, where he briefly served as managing director for APAC. Alongside operating roles, he has been an active investor and advisor since 2020, backing startups such as BotMD, Muxy, Creator plus, Intellect, Sealed and CricFlex through a creator-economy-led thesis.
Rao spent over eight years at Google, holding senior partnership roles across search, assistant, chrome, web and YouTube in APAC, and earlier cut his teeth in strategy consulting at OC&C in London and investment finance at W. P. Carey in Europe and the US.

Mukesh Ambani, Larry Fink come together for CNBC-TV18 exclusive

Nielsen launches co-viewing pilot to sharpen TV measurement

Netflix celebrates a decade in India with Shah Rukh Khan-narrated tribute film

Delhivery chairman Deepak Kapoor, independent director Saugata Gupta quit board

Meta appoints Anuvrat Rao as APAC head of commerce partnerships

Brnd.me enters Europe as haircare brands power global expansion

TechnoSport taps quick commerce with launch on Slikk’s 60-minute platform

These ’90s fashion trends are making a comeback in 2017
The final 6 ‘Game of Thrones’ episodes might feel like a full season
According to Dior Couture, this taboo fashion accessory is back
The old and New Edition cast comes together to perform
Phillies’ Aaron Altherr makes mind-boggling barehanded play
Uber and Lyft are finally available in all of New York State
Disney’s live-action Aladdin finally finds its stars
Mukesh Ambani, Larry Fink come together for CNBC-TV18 exclusive
Nielsen launches co-viewing pilot to sharpen TV measurement
Netflix celebrates a decade in India with Shah Rukh Khan-narrated tribute film
Delhivery chairman Deepak Kapoor, independent director Saugata Gupta quit board
Meta appoints Anuvrat Rao as APAC head of commerce partnerships
Brnd.me enters Europe as haircare brands power global expansion
TechnoSport taps quick commerce with launch on Slikk’s 60-minute platform
-
 News Broadcasting1 day ago
Mukesh Ambani, Larry Fink come together for CNBC-TV18 exclusive
-
 iWorld5 days ago
Netflix celebrates a decade in India with Shah Rukh Khan-narrated tribute film
-
 I&B Ministry3 months ago
India steps up fight against digital piracy
-
 iWorld3 months ago
Tips Music turns up the heat with Tamil party anthem Mayangiren
-
 MAM1 day ago
Nielsen launches co-viewing pilot to sharpen TV measurement
-
 iWorld12 months ago
BSNL rings in a revival with Rs 4,969 crore revenue
-
 MAM3 months ago
HoABL soars high with dazzling Nagpur sebut
-
 News Broadcasting2 months ago
CNN-News18 dominates Bihar election coverage with record viewership