Financials
Q3-2016: HUL YoY marketing spends up 16.4%
BENGALURU: Indian FMCG giant Hindustan Unilever Limited (HUL) Advertisement and Promotions expense (marketing spends, ASP) in Q3-2016 (quarter ended 31 December, 2015, current quarter, Q3-16) was 16.4 per cent more YoY at Rs 1,137.79 crore (14.3 Total Income from operations or TIO) as compared to Rs 977.12 crore (12.6 per cent of TIO), but declined 0.6 per cent QoQ from Rs 1,145.04 crore (14.4 per cent of TIO).
Note: (1) 100 lakh = 100,00,000 = 1 crore = 10 million.
(2) All figures in this report are standalone figures filed by the company. The trends are based on the numbers submitted by the company or picked up from the company’s website.
Company Speak
HUL chairman Harish Manwani said, “We have stepped up investment behind our brands and delivered another quarter of profitable volume led growth, consistent with our strategic intent. In an environment of moderating growth and benign input costs, we remain focused on innovation and market development to drive volumes competitively whilst improving operating margins. As channels and markets evolve, we continue to make strategic interventions to strengthen our portfolio and sharpen our executional capabilities to serve our consumers even better.”
Advertising and Sales Promotion (ASP) trends
Last quarter (Q2-16), HUL’s ASP was the highest both in terms of absolute rupees and percentage of TIO at Rs 1145.04 crore and 14.4 per cent during a 15 quarter period starting Q1-2013 until Q3-2016. The current quarter’s ASP (mentioned above) is the second highest during the same period. It must be noted than in the current fiscal (FY-2016) during all the three quarters to date, HUL’s ASP has been the highest in rupees and in terms of percentage during the period under consideration and has been above 14 per cent – in Q1-2016, it was 14.2 per cent.
The lowest ASP in absolute rupees was in Q2-2013 at Rs 768.98 crore (12.2 per cent), while it was lowest in terms of percentage of TIO in Q4-14 at 11.8 per cent (Rs 840.34 crore). The white broken trend line indicates that ASP in absolute rupees during the period under consideration shows an upward trend. ASP in terms percentage of TIO (broken pink line) also shows an upward trend, though not as sharp as in the case of absolute rupees during the period under consideration. As a matter of fact, since Q1-2013, the company’s ASP has been the highest in absolute rupees in the first quarter (Q1) and the lowest in the second quarter (Q2), the only exception being in the year 2014, where Q2-2014 ASP was the highest in the year and was more than Q1-2014 ASP, which was second highest in that year. In FY-2013 and FY-2014, ASP was lowest in Q4, while in Q4-2015, ASP was more than in Q3-2015.


HUL Revenue and PAT
Please refer to Fig B above. HUL reported 2.7 per cent YoY growth in TIO in Q3-2016 at Rs 7,980.99 crore as compared to Rs 7,774.32 crore and was 0.3 per cent higher QoQ as compared to Rs 7,955.39 crore. The company’s TIO shows a linear increasing trend as indicated by the broken blue trend line in Fig B. TIO in Q1-2016 is the highest reported by the company during the 15 quarter period under consideration in this report.
HUL’s PAT in Q3-2016 was 22.4 per cent lower YoY at Rs 971.40 crore (12.2 per cent margin) as compared to Rs 1,252.17 crore (16.1 per cent margin) and was one per cent more QoQ as compared to Rs 962.24 crore (12.1 per cent margin). During the period under consideration, HUL’s highest PAT was highest in Q1-2013 at Rs 1,331.19 crore (20.9 per cent of TIO), both in terms of absolute rupees and in percentage of TIO. While PAT in absolute rupees shows a linear increasing trend as indicated by the broken pink trend line in Fig B, while in terms of percentage of TIO, the linear trend is declining as indicated by the broken yellow line.
HUL’s take on categories and its brands
Soaps and Detergents
Robust volume growth offset by price deflation was seen. The segment witnessed continued price deflation in the quarter given the benign input costs. Skin Cleansing was driven by strong volume growth on Dove, Pears and Lifebuoy. The liquids portfolio registered another quarter of double digit growth. In Laundry, growth momentum was sustained with both Surf and Rin growing volumes in double digit while Comfort Fabric Conditioners led market development of the category and delivered another quarter of high growth. Household Care performance was driven by Vim.
Personal Products
The reported growth of this segment was impacted by the delayed winter and the one-time realignment of channel spends undertaken with a view to driving its effectiveness in the marketplace Skin Care delivered volume led growth driven by Fair and Lovely, Pond’s and Lakme. Fair and Lovely continued to do well and saw an encouraging response to the BB cream. The performance of Pond’s was led by premium skin lightening while Lakme growth was buoyed by premium innovations and facewash. Hair Care maintained its strong volume led growth momentum, with Dove and TRESemmé leading the category performance. In Oral Care, the overall performance was subdued. Close Up growth was driven by impactful activation while Pepsodent Clove and Salt continued to do well. Lakme Colour Cosmetics sustained its strong innovation led growth across the core, Absolute and 9 to 5 ranges.
Beverages
In Tea, Red Label, Taj Mahal and 3 Roses grew well, driven by focused in-market initiatives. Lipton Green Tea registered another quarter of high growth on sustained market development. In Coffee, Bru delivered double digit growth and achieved market leadership.
Packaged Foods
The segment saw its ninth successive quarter of double digit growth. Sustained market development and recent innovations resulted in another quarter of double digit growth across all key brands. Kissan maintained its strong growth momentum across both Ketchups and Jams. Knorr growth was led by new variants of Instant Soups and a new range of Knorr Chef’s Masalas was introduced at the quarter end. Ice Creams delivered another strong quarter, led by Magnum and sharper in-market execution on Kwality Walls.


MUMBAI: Godrej Industries’ June quarter numbers read like a mixed-genre script, a drama of losses on the standalone front, but a blockbuster on the consolidated stage. For Q1 FY26, the conglomerate clocked a consolidated net profit of Rs 725.35 crore, up from Rs 640.86 crore in the year-ago quarter and a sharp leap from Rs 416.13 crore in Q4 FY25. The earnings ride was powered by total income of Rs 5,718.97 crore, a 9 per cent rise year-on-year, buoyed by its FMCG, agri-business, chemicals, and real estate subsidiaries.
Segmental muscle showed in the expense sheet too cost of materials consumed stood at Rs 2,420.69 crore, while purchases of stock-in-trade rose to Rs 143.79 crore. Inventory changes delivered a significant positive swing at Rs 3,349.68 crore (credit), compared with Rs 2,011.01 crore last year, cushioning the operating line.
Finance costs came in at Rs 113.53 crore, with depreciation at Rs 576.29 crore. Profit before tax surged to Rs 1,058.56 crore from Rs 872.61 crore in Q1 FY25.
However, on a standalone basis, it was a different story, the company posted a net loss of Rs 29.98 crore, reversing from a Rs 105.26 crore profit a year earlier, hurt by higher input costs and flat revenue growth (Rs 1,018.29 crore versus Rs 986.45 crore in Q1 FY25).
Margins on the consolidated level held strong, with operating margin at 8.90 per cent and net profit margin at 16.26 per cent, an improvement from last year’s 15.09 per cent. Earnings per share stood at Rs 10.37, more than double the Rs 5.44 posted in the March quarter.
With a net worth of Rs 10,137.54 crore and debt-equity ratios steady (gross at 6.42), Godrej Industries appears well positioned for its next growth leg, even if the standalone arm needs a few scenes rewritten.
MUMBAI: R K Swamy seems to have found the right script for Q1, a plot with steady revenues, tighter expenses, and a profit scene worth watching. The integrated marketing services player posted a consolidated net profit of Rs 287.46 lakh for the quarter ended 30 June 2025, up from Rs 217.93 lakh in the year-ago period. Revenue from operations stood at Rs 7,756.79 lakh, with total income touching Rs 8,024.81 lakh, powered by Rs 268.02 lakh in other income.
Operational expenses rose to Rs 2,494.25 lakh from Rs 2,173.20 lakh, while employee costs were slightly higher at Rs 3,182.71 lakh. Other expenses climbed to Rs 1,468.53 lakh. EBITDA came in at Rs 879.32 lakh, well ahead of the Rs 703.22 lakh posted last year, though below the March quarter’s Rs 1,972.21 lakh.
Finance costs and depreciation stood at Rs 85.45 lakh and Rs 433.52 lakh respectively, leading to a profit before tax of Rs 360.35 lakh. Total tax expenses were Rs 72.89 lakh.
The quarter also saw Rs 5,400 lakh of IPO proceeds fully deployed for working capital, while Rs 3,626.22 lakh earmarked for general corporate purposes has also been utilised. However, Rs 5,458.43 lakh remains unutilised including Rs 1,098.50 lakh for a planned DVCP Studio, Rs 2,838.20 lakh for IT infrastructure across R K Swamy and its subsidiaries Hansa Research and Hansa Customer Equity, and Rs 1,521.73 lakh for new CEC and CATI facilities.
On a standalone basis, profit for the quarter was Rs 134.16 lakh versus Rs 35.18 lakh last year, with revenue from operations at Rs 3,283.06 lakh.
While adland has seen its fair share of headwinds, R K Swamy’s Q1 suggests the company is positioning itself for a year of expansion with big-ticket infrastructure investments waiting in the wings to take centre stage.
MUMBAI: In the corporate coop this quarter, Venky’s (India) Ltd has laid a golden egg. The poultry-to-oilseed giant reported a consolidated net profit of Rs 15.83 crore for the quarter ended 30 June 2025, up from Rs 15.78 crore a year ago, despite battling feed cost pressures and softer margins in its core poultry segment.
Revenue from operations climbed 7.15 per cent year-on-year to Rs 865.83 crore, compared with Rs 808.02 crore in Q1 FY25. Total income stood at Rs 877.52 crore, buoyed by Rs 11.69 crore in other income.
The company’s poultry and poultry products division remained the main profit roost, bringing in Rs 475.66 crore in sales, followed by oilseed at Rs 318.02 crore and animal health products at Rs 96.98 crore. Segment results showed poultry still feeling the heat with a loss of Rs 5.55 crore, while animal health (Rs 23.18 crore) and oilseed (Rs 10.05 crore) kept the ledger in the black.
Expenses rose to Rs 855.75 crore from Rs 717.63 crore last year, driven by higher material costs (Rs 553.08 crore) and feedstock price volatility. Finance costs edged up to Rs 4.29 crore, while depreciation came in at Rs 9.21 crore.
Earnings per share for the quarter stood at Rs 11.24, compared with Rs 11.24 in the previous quarter and Rs 9.44 a year earlier. On the balance sheet, total assets grew to Rs 2,09,115 lakh, while liabilities were steady at Rs 59,975 lakh.
While the poultry flock faced headwinds, the diversified revenue mix helped Venky’s keep its Q1 nest egg intact proving that in this business, you can still rule the roost if you spread your wings wide enough.

Mukesh Ambani, Larry Fink come together for CNBC-TV18 exclusive

Nielsen launches co-viewing pilot to sharpen TV measurement

Netflix celebrates a decade in India with Shah Rukh Khan-narrated tribute film

Delhivery chairman Deepak Kapoor, independent director Saugata Gupta quit board

Meta appoints Anuvrat Rao as APAC head of commerce partnerships

Brnd.me enters Europe as haircare brands power global expansion

TechnoSport taps quick commerce with launch on Slikk’s 60-minute platform

These ’90s fashion trends are making a comeback in 2017
The final 6 ‘Game of Thrones’ episodes might feel like a full season
According to Dior Couture, this taboo fashion accessory is back
The old and New Edition cast comes together to perform
Phillies’ Aaron Altherr makes mind-boggling barehanded play
Uber and Lyft are finally available in all of New York State
Disney’s live-action Aladdin finally finds its stars
Mukesh Ambani, Larry Fink come together for CNBC-TV18 exclusive
Nielsen launches co-viewing pilot to sharpen TV measurement
Netflix celebrates a decade in India with Shah Rukh Khan-narrated tribute film
Delhivery chairman Deepak Kapoor, independent director Saugata Gupta quit board
Meta appoints Anuvrat Rao as APAC head of commerce partnerships
Brnd.me enters Europe as haircare brands power global expansion
TechnoSport taps quick commerce with launch on Slikk’s 60-minute platform
-
 News Broadcasting2 days ago
Mukesh Ambani, Larry Fink come together for CNBC-TV18 exclusive
-
 iWorld5 days ago
Netflix celebrates a decade in India with Shah Rukh Khan-narrated tribute film
-
 I&B Ministry3 months ago
India steps up fight against digital piracy
-
 iWorld3 months ago
Tips Music turns up the heat with Tamil party anthem Mayangiren
-
 MAM2 days ago
Nielsen launches co-viewing pilot to sharpen TV measurement
-
 iWorld12 months ago
BSNL rings in a revival with Rs 4,969 crore revenue
-
 MAM3 months ago
HoABL soars high with dazzling Nagpur sebut
-
 News Broadcasting2 months ago
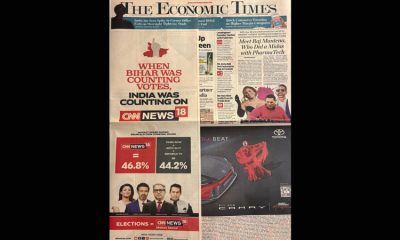
CNN-News18 dominates Bihar election coverage with record viewership