Financials
We had a good second quarter: Mark Zuckerberg
MUMBAI: Social networking site, Facebook has had a good second quarter. The company declared its financial results for the quarter ended 30 June 2014 on 23 July. Its founder and CEO Mark Zuckerberg said, “We had a good second quarter. Our community has continued to grow, and we see a lot of opportunity ahead as we connect the rest of the world.”
Operational highlights
• Daily active users (DAUs) were 829 million on average for June 2014, an increase of 19 per cent year-over-year
• Mobile DAUs were 654 million on average for June 2014, an increase of 39 per cent year-over-year
• Monthly active users (MAUs) were 1.32 billion as of 30 June 2014, an increase of 14 per cent year-over-year
• Mobile MAUs were 1.07 billion as of 30 June 2014, an increase of 31 per cent year-over-year
Financial Highlights
Revenue: Revenue for the second quarter of 2014 totaled $2.91 billion, an increase of 61 per cent, compared with $1.81 billion in the second quarter of 2013. Excluding the impact of year-over-year changes in foreign exchange rates, revenue would have increased by 59 per cent. Revenue from advertising was $2.68 billion, a 67 per cent increase from the same quarter last year. Excluding the impact of year-over-year changes in foreign exchange rates, revenue from advertising would have increased by 65 per cent. Mobile advertising revenue represented approximately 62 per cent of advertising revenue for the second quarter of 2014, up from approximately 41 per cent of advertising revenue in the second quarter of 2013. Payments and other fees revenue was $234 million, a 9 per cent increase from the same quarter last year.
Costs and expenses: GAAP costs and expenses for the second quarter of 2014 were $1.52 billion, an increase of 22 per cent from the second quarter of 2013. Excluding share-based compensation and related payroll tax expenses, non-GAAP costs and expenses were $1.2 billion in the second quarter of 2014, up 18 per cent compared to $1.02 billion for the second quarter of 2013.
Income from operations: For the second quarter of 2014, GAAP income from operations was $1.39 billion, up 147 per cent compared to $562 million in the second quarter of 2013. Excluding share-based compensation and related payroll tax expenses, non-GAAP income from operations for the second quarter of 2014 was $1.71 billion, up 116 per cent compared to $794 million for the second quarter of 2013.
Operating margin: GAAP operating margin was 48 per cent for the second quarter of 2014, compared to 31 per cent in the second quarter of 2013. Excluding share-based compensation and related payroll tax expenses, non-GAAP operating margin was 59 per cent for the second quarter of 2014, compared to 44 per cent for the second quarter of 2013.
Provision for income taxes: GAAP income tax expense for the second quarter of 2014 was $595 million, representing a 43 per cent effective tax rate. Excluding share-based compensation and related payroll tax expenses, the non-GAAP effective tax rate would have been approximately 36 per cent.
Net income and EPS: For the second quarter of 2014, GAAP net income was $791 million, up 138 per cent compared to $333 million for the second quarter of 2013. Excluding share-based compensation and related payroll tax expenses and income tax adjustments, non-GAAP net income for the second quarter of 2014 was $1.09 billion, up 124 per cent compared to $488 million for the second quarter of 2013.
GAAP diluted EPS was $0.30 in the second quarter of 2014, up 131% compared to $0.13 in the second quarter of 2013. Excluding share-based compensation and related payroll tax expenses and income tax adjustments, non-GAAP diluted EPS for the second quarter of 2014 was $0.42, up 121 per cent compared to $0.19 in the second quarter of 2013.
Capital expenditures: Capital expenditures for the second quarter of 2014 were $469 million.
Cash and marketable securities: Cash and marketable securities were $13.96 billion at the end of the second quarter of 2014.
Free cash flow: Free cash flow for the second quarter of 2014 was $872 million.


MUMBAI: Godrej Industries’ June quarter numbers read like a mixed-genre script, a drama of losses on the standalone front, but a blockbuster on the consolidated stage. For Q1 FY26, the conglomerate clocked a consolidated net profit of Rs 725.35 crore, up from Rs 640.86 crore in the year-ago quarter and a sharp leap from Rs 416.13 crore in Q4 FY25. The earnings ride was powered by total income of Rs 5,718.97 crore, a 9 per cent rise year-on-year, buoyed by its FMCG, agri-business, chemicals, and real estate subsidiaries.
Segmental muscle showed in the expense sheet too cost of materials consumed stood at Rs 2,420.69 crore, while purchases of stock-in-trade rose to Rs 143.79 crore. Inventory changes delivered a significant positive swing at Rs 3,349.68 crore (credit), compared with Rs 2,011.01 crore last year, cushioning the operating line.
Finance costs came in at Rs 113.53 crore, with depreciation at Rs 576.29 crore. Profit before tax surged to Rs 1,058.56 crore from Rs 872.61 crore in Q1 FY25.
However, on a standalone basis, it was a different story, the company posted a net loss of Rs 29.98 crore, reversing from a Rs 105.26 crore profit a year earlier, hurt by higher input costs and flat revenue growth (Rs 1,018.29 crore versus Rs 986.45 crore in Q1 FY25).
Margins on the consolidated level held strong, with operating margin at 8.90 per cent and net profit margin at 16.26 per cent, an improvement from last year’s 15.09 per cent. Earnings per share stood at Rs 10.37, more than double the Rs 5.44 posted in the March quarter.
With a net worth of Rs 10,137.54 crore and debt-equity ratios steady (gross at 6.42), Godrej Industries appears well positioned for its next growth leg, even if the standalone arm needs a few scenes rewritten.
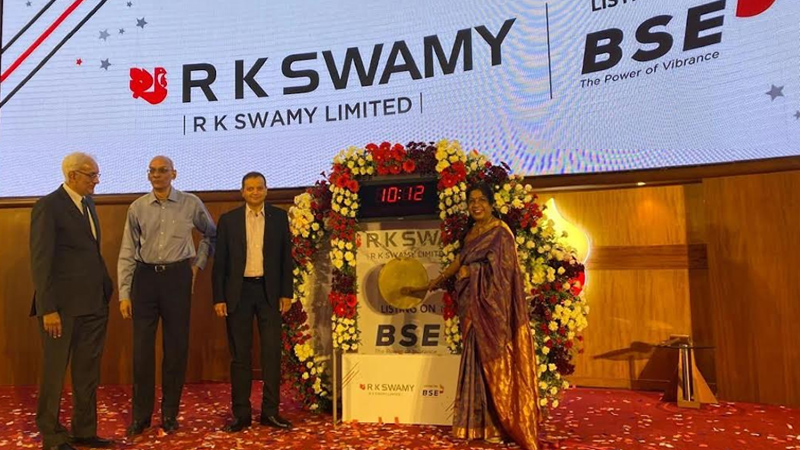
MUMBAI: R K Swamy seems to have found the right script for Q1, a plot with steady revenues, tighter expenses, and a profit scene worth watching. The integrated marketing services player posted a consolidated net profit of Rs 287.46 lakh for the quarter ended 30 June 2025, up from Rs 217.93 lakh in the year-ago period. Revenue from operations stood at Rs 7,756.79 lakh, with total income touching Rs 8,024.81 lakh, powered by Rs 268.02 lakh in other income.
Operational expenses rose to Rs 2,494.25 lakh from Rs 2,173.20 lakh, while employee costs were slightly higher at Rs 3,182.71 lakh. Other expenses climbed to Rs 1,468.53 lakh. EBITDA came in at Rs 879.32 lakh, well ahead of the Rs 703.22 lakh posted last year, though below the March quarter’s Rs 1,972.21 lakh.
Finance costs and depreciation stood at Rs 85.45 lakh and Rs 433.52 lakh respectively, leading to a profit before tax of Rs 360.35 lakh. Total tax expenses were Rs 72.89 lakh.
The quarter also saw Rs 5,400 lakh of IPO proceeds fully deployed for working capital, while Rs 3,626.22 lakh earmarked for general corporate purposes has also been utilised. However, Rs 5,458.43 lakh remains unutilised including Rs 1,098.50 lakh for a planned DVCP Studio, Rs 2,838.20 lakh for IT infrastructure across R K Swamy and its subsidiaries Hansa Research and Hansa Customer Equity, and Rs 1,521.73 lakh for new CEC and CATI facilities.
On a standalone basis, profit for the quarter was Rs 134.16 lakh versus Rs 35.18 lakh last year, with revenue from operations at Rs 3,283.06 lakh.
While adland has seen its fair share of headwinds, R K Swamy’s Q1 suggests the company is positioning itself for a year of expansion with big-ticket infrastructure investments waiting in the wings to take centre stage.
MUMBAI: In the corporate coop this quarter, Venky’s (India) Ltd has laid a golden egg. The poultry-to-oilseed giant reported a consolidated net profit of Rs 15.83 crore for the quarter ended 30 June 2025, up from Rs 15.78 crore a year ago, despite battling feed cost pressures and softer margins in its core poultry segment.
Revenue from operations climbed 7.15 per cent year-on-year to Rs 865.83 crore, compared with Rs 808.02 crore in Q1 FY25. Total income stood at Rs 877.52 crore, buoyed by Rs 11.69 crore in other income.
The company’s poultry and poultry products division remained the main profit roost, bringing in Rs 475.66 crore in sales, followed by oilseed at Rs 318.02 crore and animal health products at Rs 96.98 crore. Segment results showed poultry still feeling the heat with a loss of Rs 5.55 crore, while animal health (Rs 23.18 crore) and oilseed (Rs 10.05 crore) kept the ledger in the black.
Expenses rose to Rs 855.75 crore from Rs 717.63 crore last year, driven by higher material costs (Rs 553.08 crore) and feedstock price volatility. Finance costs edged up to Rs 4.29 crore, while depreciation came in at Rs 9.21 crore.
Earnings per share for the quarter stood at Rs 11.24, compared with Rs 11.24 in the previous quarter and Rs 9.44 a year earlier. On the balance sheet, total assets grew to Rs 2,09,115 lakh, while liabilities were steady at Rs 59,975 lakh.
While the poultry flock faced headwinds, the diversified revenue mix helped Venky’s keep its Q1 nest egg intact proving that in this business, you can still rule the roost if you spread your wings wide enough.

Mukesh Ambani, Larry Fink come together for CNBC-TV18 exclusive

Nielsen launches co-viewing pilot to sharpen TV measurement

Netflix celebrates a decade in India with Shah Rukh Khan-narrated tribute film

Delhivery chairman Deepak Kapoor, independent director Saugata Gupta quit board

Meta appoints Anuvrat Rao as APAC head of commerce partnerships

Brnd.me enters Europe as haircare brands power global expansion

TechnoSport taps quick commerce with launch on Slikk’s 60-minute platform

These ’90s fashion trends are making a comeback in 2017
The final 6 ‘Game of Thrones’ episodes might feel like a full season
According to Dior Couture, this taboo fashion accessory is back
The old and New Edition cast comes together to perform
Phillies’ Aaron Altherr makes mind-boggling barehanded play
Uber and Lyft are finally available in all of New York State
Disney’s live-action Aladdin finally finds its stars
Mukesh Ambani, Larry Fink come together for CNBC-TV18 exclusive
Nielsen launches co-viewing pilot to sharpen TV measurement
Netflix celebrates a decade in India with Shah Rukh Khan-narrated tribute film
Delhivery chairman Deepak Kapoor, independent director Saugata Gupta quit board
Meta appoints Anuvrat Rao as APAC head of commerce partnerships
Brnd.me enters Europe as haircare brands power global expansion
TechnoSport taps quick commerce with launch on Slikk’s 60-minute platform
-
 News Broadcasting3 days ago
Mukesh Ambani, Larry Fink come together for CNBC-TV18 exclusive
-
 iWorld7 days ago
Netflix celebrates a decade in India with Shah Rukh Khan-narrated tribute film
-
 MAM3 months ago
HoABL soars high with dazzling Nagpur sebut
-
 MAM3 days ago
Nielsen launches co-viewing pilot to sharpen TV measurement
-
 iWorld12 months ago
BSNL rings in a revival with Rs 4,969 crore revenue
-
 I&B Ministry3 months ago
India steps up fight against digital piracy
-
 iWorld3 months ago
Tips Music turns up the heat with Tamil party anthem Mayangiren
-
 News Broadcasting2 months ago
CNN-News18 dominates Bihar election coverage with record viewership