Connect with us
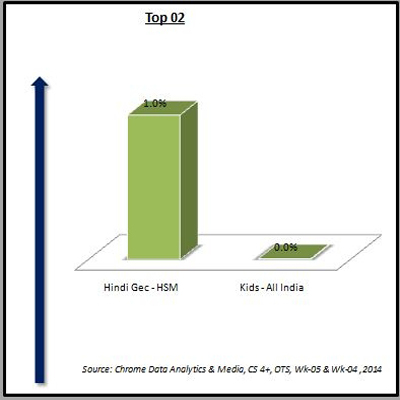
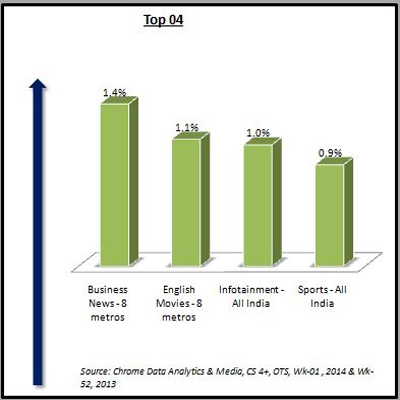
MUMBAi: The opportunity to see (OTS) collated by Chrome Data Analytics & Media is out for week five. As per the data collected, the Hindi...
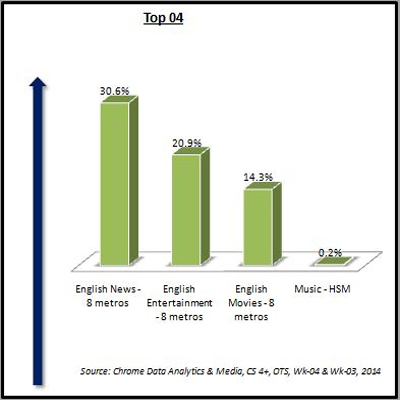
MUMBAI: After a lull period in week three, the viewers are back in form as the viewership of the idiot box has gone up considerably. ...
MUMBAI: Global advertising expenditures were up 3.2 per cent in the third quarter of 2013 for year-over-year period, driven largely by Asia Pacific’s expanding powerhouse ad...
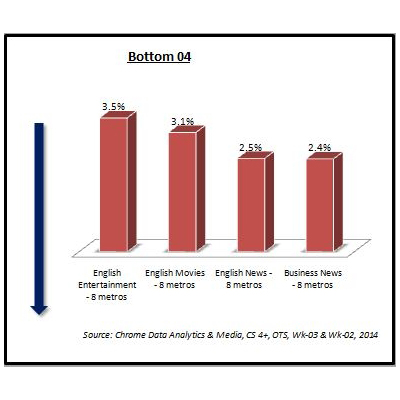
MUMBAI: It looks like that TV viewers are taking a break for a while. In the week three of opportunity to see (OTS) collated by Chrome...
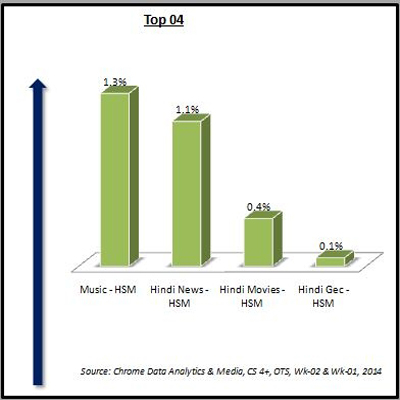
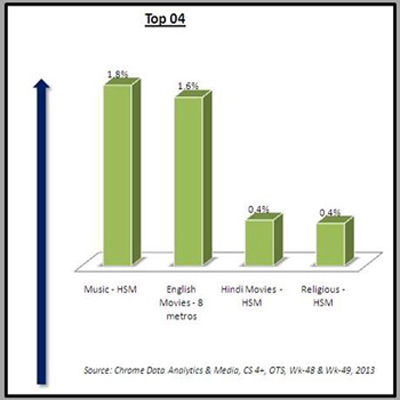
MUMBAI: It seems the New Year celebrations are not going to fade away so easily. The TV viewers gave thumbs up to the music channels as...

NEW DELHI: The growing pay TV subscriber market is set to drive further investment into the technology underpinning multi-screen and OTT TV services as the global...
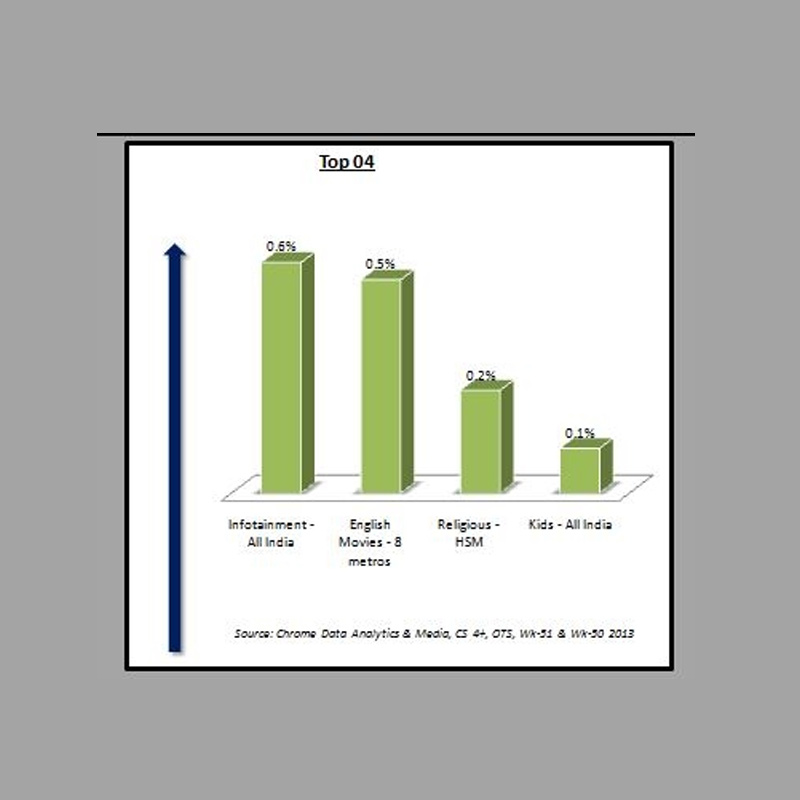
MUMBAI: Money isn’t thought to be the biggest cause of worry for no reason. At least it seems so in this case. As the New Year...
MUMBAI: The year 2013 saw the Telecom Regulatory Authority of India (TRAI) cracking its whip on the broadcasters as well as every other party within the...
MUMBAI: While we thought it’s the news stories that the masses are interested in, the fact seems to be something different. While the TV viewers want...

MUMBAI: The satellite and cable pay-TV market is slowing down due to the emergence of new technology platforms. Net subscriber addition in the global pay-TV...
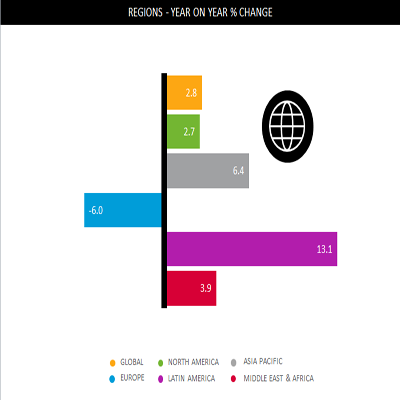
NEW DELHI: Ad spends grew by a substantial 6.4 per cent in the first half of 2013, making it the largest growth among different regions of...
MUMBAI: From exit polls to winning speeches, week 49 should have been the week of news channels. However, the truth is far from it. According to...

MUMBAI: If you thought only the make-up clad, good-looking bahu from a traditional Indian household managing everything perfectly, could grab the attention of the Indian TV...

MUMBAI: Connectivity of a television channel is something that every executive is concerned about in the industry – whether in the media or broadcast sector or cable...
MUMBAI: About three in ten (29 per cent) Indians who drive indicate they text, email, or use social media while they are driving (even when...
MUMBAI: About nine in ten (88 per cent) online consumers in India indicate that in the past month, they have shared some type of content on...

Carriage fees have been a bane of the Indian television industry. Most broadcasters have been groaning and moaning how they have been choking up their capital,...
The Media Research Users Council (MRUC) has released the topline findings of the Indian Readership Survey (IRS) 2006 (Round 16). The study, conducted for the period...
Media matters and how. Lintas Media Services has churned out a comprehensive media guide, which is an analysis of media spends and buys in the year...
Media matters and how. Lintas Media Services has churned out a comprehensive media guide, which is an analysis of media spends and buys in the year...
Media matters and how. Lintas Media Services has churned out a comprehensive media guide, which is an analysis of media spends and buys in the year...
Will I get fewer eyeballs for my advertising? Do I need to increase my budget to reach the same number of people through Television? Is my...
The Indian media and entertainment industry is expected to grow at 19 per cent compound annual growth rate to reach Rs 837.4 billion by 2010 from...
MUMBAI: A total of 694 million people, age 15+, used the internet worldwide from all locations in March 2006, representing 14 per cent of the world’s...
Among Hindi general entertainment channels (GEC), only Star Plus has been able to really improve its position in the regional television space over the years, according...

TV Pulse 2005, the annual research initiative put together by the Joint Industry Body (JIB) and Tam Media, series continues with the paper – Reel Pointer...

TV Pulse 2005, the annual research initiative put together by the Joint Industry Body (JIB) and Tam Media, series continues with the paper – TV Viewing:...

TV Pulse 2005, the annual research initiative put together by the Joint Industry Body (JIB) and Tam Media, series continues with the paper – Deriving further...

TV Pulse 2005, the annual research initiative put together by the Joint Industry Body (JIB) and Tam Media, series continues with the paper – Have you...
TV Pulse 2005, the annual research initiative put together by the Joint Industry Body (JIB) and Tam Media, series continues with the paper – set2view:who‘s watching...

TV Pulse 2005, the annual research initiative put together by the Joint Industry Body (JIB) and Tam Media, series continues with the paper – A study...
MUMBAI: According to the IDC India Mobile Handsets Study 2005, current mobile users are willing to spend Rs 7500 on an average, while buying the next...

Indian Idol‘s finale has done for Sony Entertainment Television (SET) what no other show has done for it till date. The year on year monopoly of...
BANGALORE: Indian Space Research Organisation (ISRO) will be launching four satellites this year. The satellites in the pipeline include Cartosat-1 & Carrostat-2 – remote sensing mapping...

The new Lodestar report examines the performance of the news channels from different angles. It throws up interesting findings, apart from how the public perceives news...

Front page readership is very high while sports and edit sections get less readers. These are just a few of the findings that the survey SPARR...
MUMBAI: There are two new launches on television this week. The one that is hogging the limelight is of course Zee’s mega serial Awaaz…dil se dil...

Ratings don‘t answer all issues facing planners and broadcasters alike, qualitative data is what is needed.Psychographics are becoming more important than ever before and insights into...

A study carried out by Starcom Worldwide and Hansa Research Group to understand the viewer‘s viewpoint on CAS shows that not only is the consumer aware...

BBC World has the highest percentage of unduplicated viewers after Aaj Tak, concludes a NFL MBO study that surveyed India‘s leading consumers to observe their lifestyle,...

Fiction is still the king. That‘s the verdict of a French study that indicates that of the 1117 new shows launched between September 2001 and May...

It is only the ‘privileged‘ urban homes that feature on satellite channels in India, finds a study conducted on gender representation on satellite television by the...

It may sound Utopian, but the Entertainment Report, put out by the Confederation of Indian Industry (CII) and Ernst & Young, believes that a self-regulatory body...

Television and the Internet are the only media that have consolidated their reach in India in the period between December 2000 and June 2001, according to...

There‘s good news round the corner for the Indian ad industry. The annual forecast of global advertising expenditure till 2004 released by Zenith Optimedia Group this...


Reliance and BlackRock chiefs map the future of investing as global capital eyes India

Super Bowl pilot to refine how shared TV audiences are counted


MUMBAI: Netflix is celebrating ten years in India with a slick anniversary film voiced by Shah Rukh Khan, a nostalgic...


Gurugram: Delhivery’s boardroom is being reset. Deepak Kapoor, chairman and independent director, has resigned with effect from April 1 as...

SINGAPORE: Anuvrat Rao has taken charge as APAC head of commerce and signals partnerships at Meta, steering monetisation deals across...


Bengaluru: Brnd.me, the global consumer brands company formerly known as Mensa Brands, has entered the European market following strong momentum...


NATIONAL: TechnoSport has launched on Slikk, the ultra-fast fashion app offering 60-minute delivery, as the activewear brand accelerates its push...

MUMBAI: Jitendra Singh has been appointed senior vice president and division head – special projects at Reliance Industries Limited, marking...


MUMBAI: Dating, it turns out, is less about grand gestures and more about shared moments. The song you both hum,...


MUMBAI: This Republic Day, Godrej brought modern washing technology to the care of Indian handlooms. The appliances business of Godrej...


BENGALURU: Wipro Limited hosted the 15th edition of the Wipro earthian Awards 2025 at Azim Premji University, recognising schools and...


Gurugram: Blinkit has elevated Tulasi Mohan Padavala to associate director, capping a three-year climb inside the quick-commerce firm and signalling...


Noida: Haldiram’s has tapped a seasoned brand builder to sharpen its quick-service ambitions. Rajiv Singh has joined the snacks-to-sweets giant...


MUMBAI: When the stakes rise and seconds matter, even payments need a match-winning finish. That’s the cue for Bharatpe, which...


BENGALURU: In a city where red lights usually test patience and tempers, Oben Electric decided to give them a new job....
