Connect with us

MUMBAI: In the last two years, the Indian Media and Entertainment industry has seen a stark increase in fraud related cases that have contributed to a...

MUMBAI: WPP’s GrpupM is out with its biannual ‘This Year, Next Year’ report forecasting the global advertising investments. As per the report the ad spends will...
MUMBAI: The Communication Market 2014 report of Ofcom, an independent regulator and competition authority for the UK communications industries, highlights that TV industry generated ?12.9 billion...
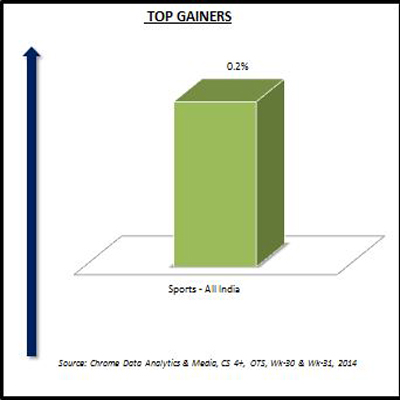
MUMBAI: The week 31 of opportunity to see (OTS) for the data collated by Chrome Data Analytics & Media saw only one gainer. The sole...

MUMBAI: Media Partners Asia (MPA) has come out with its report on the Asia Pacific pay-TV and broadband market for the next five years. It predicts...
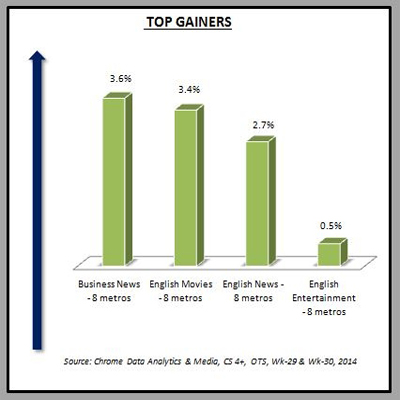
MUMBAI: Once again the opportunity to see (OTS) numbers collated by Chrome Data Analytics & Media saw an upward peak. Week 30 saw maximum growth...

MUMBAI: The process of digitisation in India currently seems to be stuck in limbo. Even with several deadlines being set, the country doesn’t seem to have...

MUMBAI: A report released by Digital TV Research has thrown some light on how satellite TV revenues will change between now and 2020. The report, that...
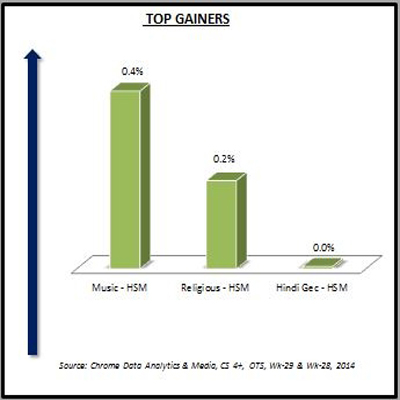
MUMBAI: After seeing a peak in opportunity to see (OTS) of various genres collated by Chrome Data Analytics & Media, week 29 didn’t see much rise....

NEW DELHI: The Asia Pacific region has shown major growth of six per cent year-over-year in the telecom/datacom equipment and software revenue as against 4.5 per...

Highlights: • Travel & Tourism Advertising accounted for 78% growth during Jan – Dec 2013 in comparison with Jan – Dec 2012 • Travel & Tourism...
MUMBAI: Imagine spending all your time and effort on a project, which doesn’t even give a chance for a second glance? Well, this is what is...

KOLKATA: As the Union Railway Minister Sadananda Gowda started presenting his maiden Rail Budget in Lok Sabha on 8 July, Esha Media Research, a media monitoring...
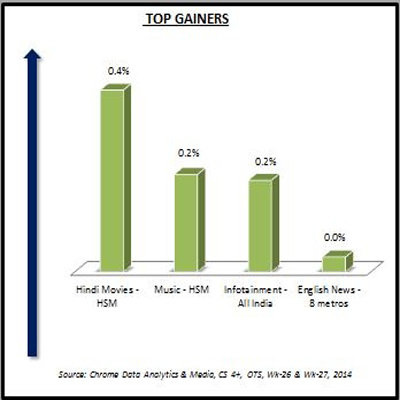
MUMBAI: As per Chrome Data Analytics & Media which collates opportunity to see (OTS), week 27 didn’t see any gain. Hindi Movies in the Hindi...

Highlights: • Oral Hygiene Sector Advertising on TV accounted for 29% growth during Jan – Dec 2013 in comparison with Jan – Dec 2012 • ...

NEW DELHI: The mobile appears to be leading the increase in media ad spending this year, at least in the United States. Total ad investments...

NEW DELHI: Even as television news channels in India are showing a rise, the actual amount of news content is dropping. A study shows that the...

MUMBAI: Little did anyone know that the Modi sarkar that had vowed to boost growth, control inflation and restore investor confidence will actually work wonders at...

KOLKATA: After monitoring over 140 channels in regional languages broadcast across the country, Esha Media Research, a media monitoring and research company, is gearing up to...
MUMBAI: Expressions say it all, and researchers for long now have been reading people’s faces to know it all. A smile, a frown, a grin and...

KOLKATA: Commercial banks in the country hold a relatively negligible news space in the television spectrum compared to their advertising budgets. Also, CNBC TV18 continues...

Highlights: • Toilet Soap Advertising accounted for 43% growth during Jan – Dec 2013 in comparison with Jan – Dec 2013 • Toilet Soaps was the...
NEW DELHI: The year 2013 was marked by updates that have altered search marketing irreversibly. Post-hummingbird, marketers are forced to think of organic search in a...

Highlights: • Soft Drink Advertising accounted for 18% growth during Jan – Dec 2013 in comparison with Jan – Dec 2012 • February to May was...

NEW DELHI: Television remains the “key” viewer for video in American homes, but video is increasingly coming from the internet which is taking some toll on...

Highlights: •Laundry Product Advertising on TV witnessed growth of 22% in Jan – Dec 2013 in comparison with Jan – Dec 2012 •Hindustan Unilever...

KOLKATA: Esha Media Research, a media monitoring and research company, which currently monitors 140 channels, across the nation in all languages is looking at expanding its...

KOLKATA: With the 2014 Lok Sabha elections likely to become a case study for the whole country, Esha Media Research, a media monitoring and research company,...

KOLKATA: Esha Media Research, a media monitoring and research company, has plans of increasing its reach. The media monitoring company, which currently monitors 140 channels, across...

Highlights: ° Services Sector Advertising accounted for 26% growth during Jan – Dec 2013 in comparison with Jan – Dec 2012 ° Top 5 Product...

Highlights: • Auto Advertising accounted for 11% growth during Jan – Dec 2013 in comparison with Jan – Dec 2012 • Top 5 Product Groups advertised...

MUMBAI: Digital pay TV is slowing down in Asia. That was the key takeaway from Media Partners Asia (MPA) executive director Vivek Couto’s annual report on...

MUMBAI: 50 per cent Indians are optimistic about Indian economy and expect that the economy will be stronger in next six months, a rise of two...

BENGALURU: The FICCI-KPMG Media and Entertainment Report 2014 (M&E-2014 Report) says that the private FM radio industry comprises network players (national, regional and metro-focused), single stations...
BENGALURU: The FICCI-KPMG Media and Entertainment Report 2014 (M&E-2014 Report) says that the radio industry outperformed all other traditional media segments by clocking a growth of...
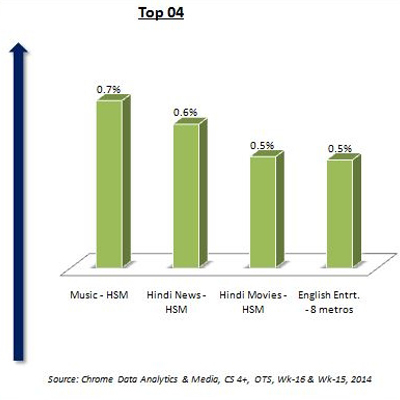
MUMBAI: In week 16 of opportunity to see (OTS) data collated by Chrome Data, Analytics & Media, Music genre in the Hindi speaking market (HSM) was...

MUMBAI: Continuing its trend of surveying top CEOs across the globe, PricewaterhouseCoopers (PwC) surveyed 1344 business leaders across 68 countries out of which 72 were media...

BENGALURU: Though a majority of Indians prefer watching ‘live TV’, other forms of content viewing such as streaming or downloading from a computer, internet TV, etc.,...

NEW DELHI: The global business and residential VoIP services market rose eight per cent in 2013 to $68 billion and are expected to yield a revenue of...

MUMBAI: News channel ABP that carries out its election poll in association with research agency Nielsen India has come up with its latest prediction on which...

MUMBAI: Digital TV penetration reached 94.2 per cent at the end of 2013, and will increase to 100 per cent by 2017 is the forecast that...
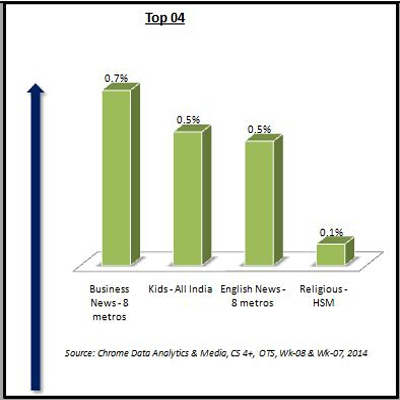
MUMBAI: No major change happened in week nine as per the opportunity to see (OTS) data collated by Chrome Data Analytics & Media for the week....
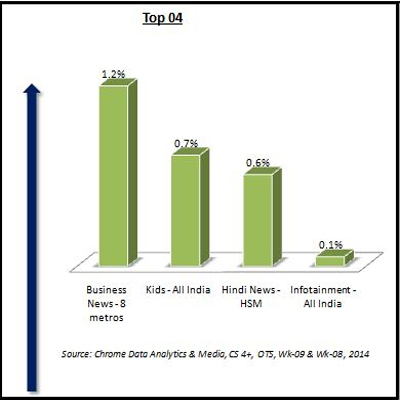
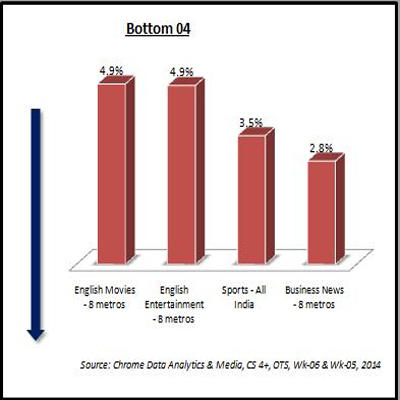
MUMBAI: In the Week eight of opportunity to see (OTS) collated by Chrome Data Analytics & Media, Business news channels in the eight metros at the...

MUMBAI: New research from Parks Associates reveals that usage of TV apps is on the rise, with 55 per cent of US smartphone owners and 61...

MUMBAI: According to a recent research from Thinkbox, 98.5 per cent of television viewing in the UK in 2013 was through a TV set, with just...

MUMBAI: If the new report released by PricewaterhouseCoopers (PwC) comes true, the media and entertainment sector could witness increasingly lucrative retransmission fees and high value for...
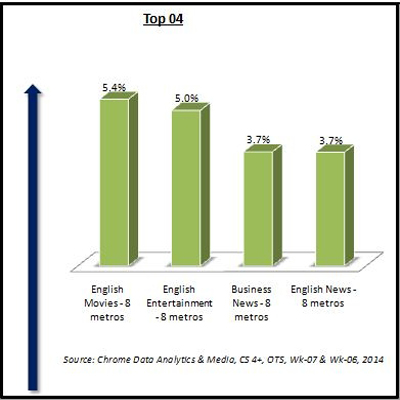
MUMBAI: The opportunity to see (OTS) data collated by Chrome Data Analytics & Media for week seven has been released with the highest gainer of the...

MUMBAI: It’s the leader in the Hindi general entertainment space in India and has been so for most part since the beginning of last decade. ...
MUMBAI: The opportunity to see (OTS) collated by Chrome Data Analytics & Media is out for week six, but doesn’t look too good. The past...

Platforms get three years to add features for hearing and visually impaired


Strong word-of-mouth turns Pongal satire into remake pick


Streaming giant bets on a seasoned marketer who helped build Amazon and Netflix into household names


Communications leader exits after three years spanning MD office strategy and media outreach.


Cricket star named face of Delhi Khel Mahakumbh to fuel youth talent hunt.


Kolkata-based beverage maker reports stronger revenues and profits for December quarter.


A crime thriller steps out of the shadows as Telugu storytelling claims centre stage.


From boards to bytes, chess readies for a nation-first showdown in Riyadh.


Leadership change follows layoffs, protests and a bruising battle over trust.

Revenue rises 4.3 per cent to Rs 10,209.33 crore while deferred tax gain lifts bottom line sharply


Akshay Kumar and stars launch awards at NSCI Dome on Feb 28


Merger creates one-stop hub for content, digital, and delivery


NEW DELHI: Hamdard Laboratories gathered a cross-section of India’s achievers in New Delhi on Friday, handing out the Hakeem Abdul...


MUMBAI: For decades, creative storytelling has been the cornerstone of brand communication. The “big idea” amplified through catchy jingles, striking...


MUMBAI: Zepto has elevated Ahmad Muneeb to vice president – HR centre of excellence, placing him at the helm of...
